Truth and Integrity in State Budgeting - Preparing for the Storm

Preparing for the Storm
Preface
This report marks the Volcker Alliance’s fourth comprehensive assessment of the budget practices of the fifty US states and provides an analysis of fiscal actions from fiscal 2015 through 2019. During the period, many states took advantage of a record-long economic recovery and growing tax revenues to strengthen their budget processes as well as their rainy day funds and other emergency cash reserves. While no one could have foreseen the public health, economic, and fiscal stresses caused by the onset in 2020 of the COVID-19 pandemic, actions taken by states during the boom times for employment and gross domestic product left many better prepared for hard times than they were only a few years earlier.
Like Truth and Integrity in State Budgeting reports published in 2017, 2018, and 2020, this study grades states’ success in pursuing transparent and fiscally sustainable procedures as they attempt to keep revenues and expenditures in balance from the beginning to the end of each year. And as we did in the three previous reports, we gave states grades of A to D-minus, the lowest possible mark, for their practices in five building blocks of budgeting:
- Budget forecasting, in which we evaluate how and whether states estimate revenues and expenditures for the coming fiscal year and the long term;
- Budget maneuvers, in which dependence on one-time actions to offset recurring expenditures is measured;
- Legacy costs, in which we assess how well states are funding promises made to public employees to cover retirement costs, including pensions and retiree health care;
- Reserve funds, in which the condition of general fund reserves as well as rainy day funds and rules governing their use and replenishment are scrutinized; and
- Budget transparency, in which we examine the disclosure of budget information, including debts, tax expenditures, and the estimated cost of deferred infrastructure maintenance.
In this report, we also provide states’ annual budgetary grades for each of the five years covered and provide individual report cards for each state across the five budget categories.
Introduction
This study and accompanying state report cards are the result of comprehensive research on state budgets from fiscal 2015 through 2019. In the following pages, we review how successful states were in creating more sustainable budgetary practices in the wake of the Great Recession. One encouraging sign is that, on average, states showed steady increases in their annual grades in all five fundamental categories identified by the Volcker Alliance: budget forecasting, budget maneuvers, reserve funds, legacy costs, and transparency. While some of those gains will inevitably be surrendered as states face the exigencies caused by the COVID-19 pandemic (see box), many of the improvements in budgetary practices have been enshrined in statutes and should prove more durable over the long haul. These budgetary foundations that states laid out in eleven years of economic growth will in no small measure help support their eventual recovery.
We published our initial examination of budgetary practices in 2015, Truth and Integrity in State Budgeting: Lessons from Three States, tracking California, New Jersey, and Virginia. We then began our scrutiny of all fifty states in 2017 in Truth and Integrity in State Budgeting: What Is the Reality? In that study and two subsequent studies, Truth and Integrity in State Budgeting: Preventing the Next Fiscal Crisis (2018) and Truth and Integrity in State Budgeting: The Balancing Act (2020), we drew attention to prevailing budgetary practices, identifying the strongest and weakest, and encouraged efforts to raise standards for all states. In this summation of five years of research, we continue to follow the mission we laid out in 2017: It is to highlight states with “practices that should be followed nationwide as much as it is to criticize those that fall short.”1
This report shows in greater detail the progress achieved over the entire study period, as well as areas that will need improvement when the pandemic retreats and the economy returns to a more normal trajectory. In the following chapters, we review states’ grades and trends in the five budgeting categories cited above. We also briefly review fiscal actions that states took in 2020 to close budgetary shortfalls caused by the pandemic, and present a set of state report cards containing budget grades and explanations of our assessments spanning fiscal 2015–19. In documenting which states met or exceeded best-practice standards in the period and which fell short, we provide a baseline for future research that will examine how states are reacting to an environment that is far more difficult than the one they enjoyed little more than a year ago.
Conclusions
As in previous editions of Truth and Integrity in State Budgeting, we have graded states in five fundamental categories that are critical to their ability to maintain budgetary balance for the long term and for each year evaluated. For fiscal 2015 through 2019, states were graded on a scale of A to D-minus. (The Alliance does not issue an F mark; even the most fiscally challenged states have some budget practices worth emulating.) The areas of evaluation and principles underlying our assessments include the following:
Budget forecasting. States should adopt binding consensus estimates for revenues and make predictions about both revenues and expenditures for more than the next fiscal year. A one-year estimate does little to reveal structural deficits that may burden subsequent budgets. States should provide explanatory details to support forecasts of revenue growth. The average grade in the category was C.
Budget maneuvers. To avoid creating long-term structural deficits that burden future budgets, states should pay for expenditures with recurring revenues earned the same year. Budget maneuvers are states’ major tool for moving budgeted costs to the future or bringing expected revenues into the current year. By their very nature, such one-time actions may not be sustainable year to year, although some particularly challenged states, including Illinois, Kansas, New Jersey, New York, and Pennsylvania, consistently used maneuvers to balance budgets in the five fiscal years studied. The category average was B, with the use of one-time actions decreasing slightly nationwide amid the economic recovery.
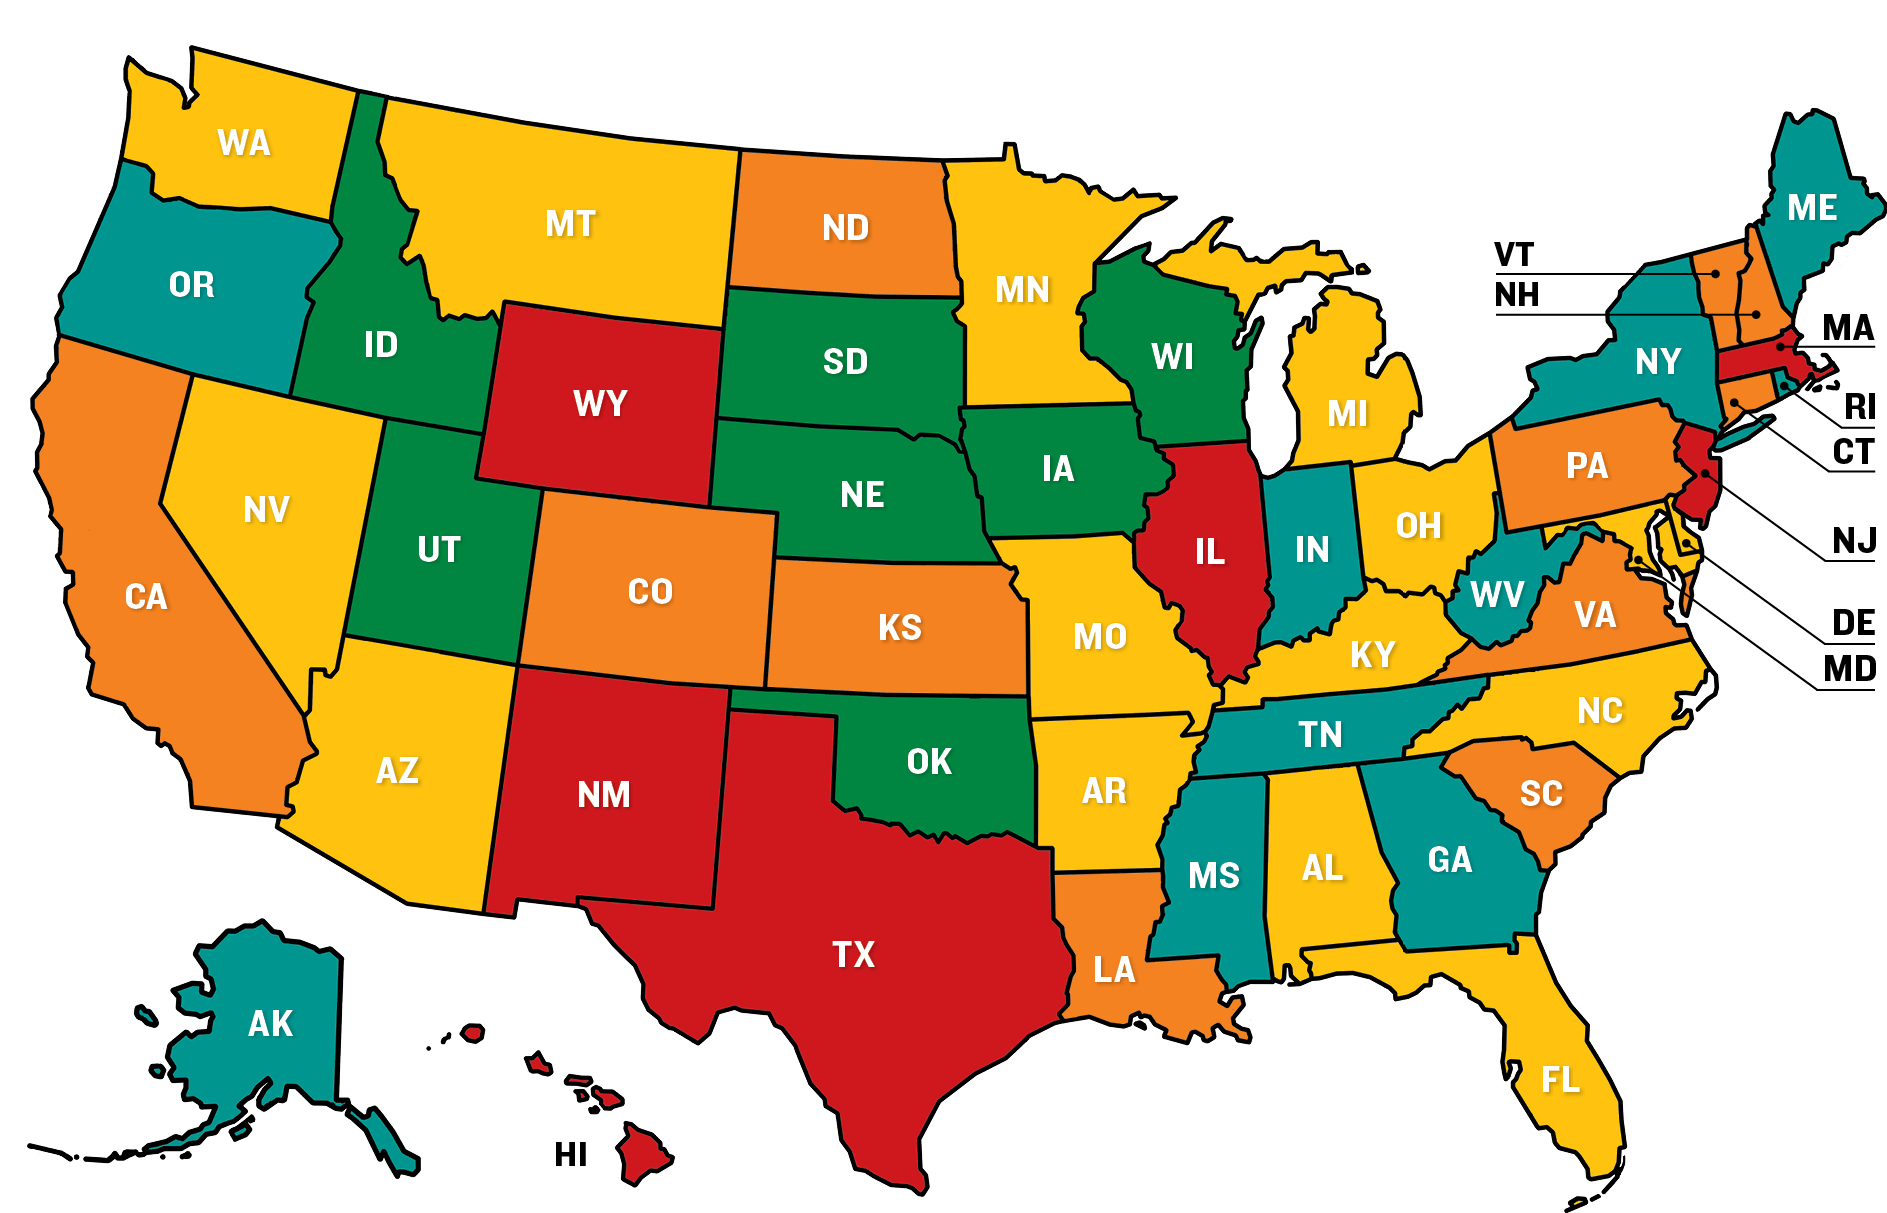
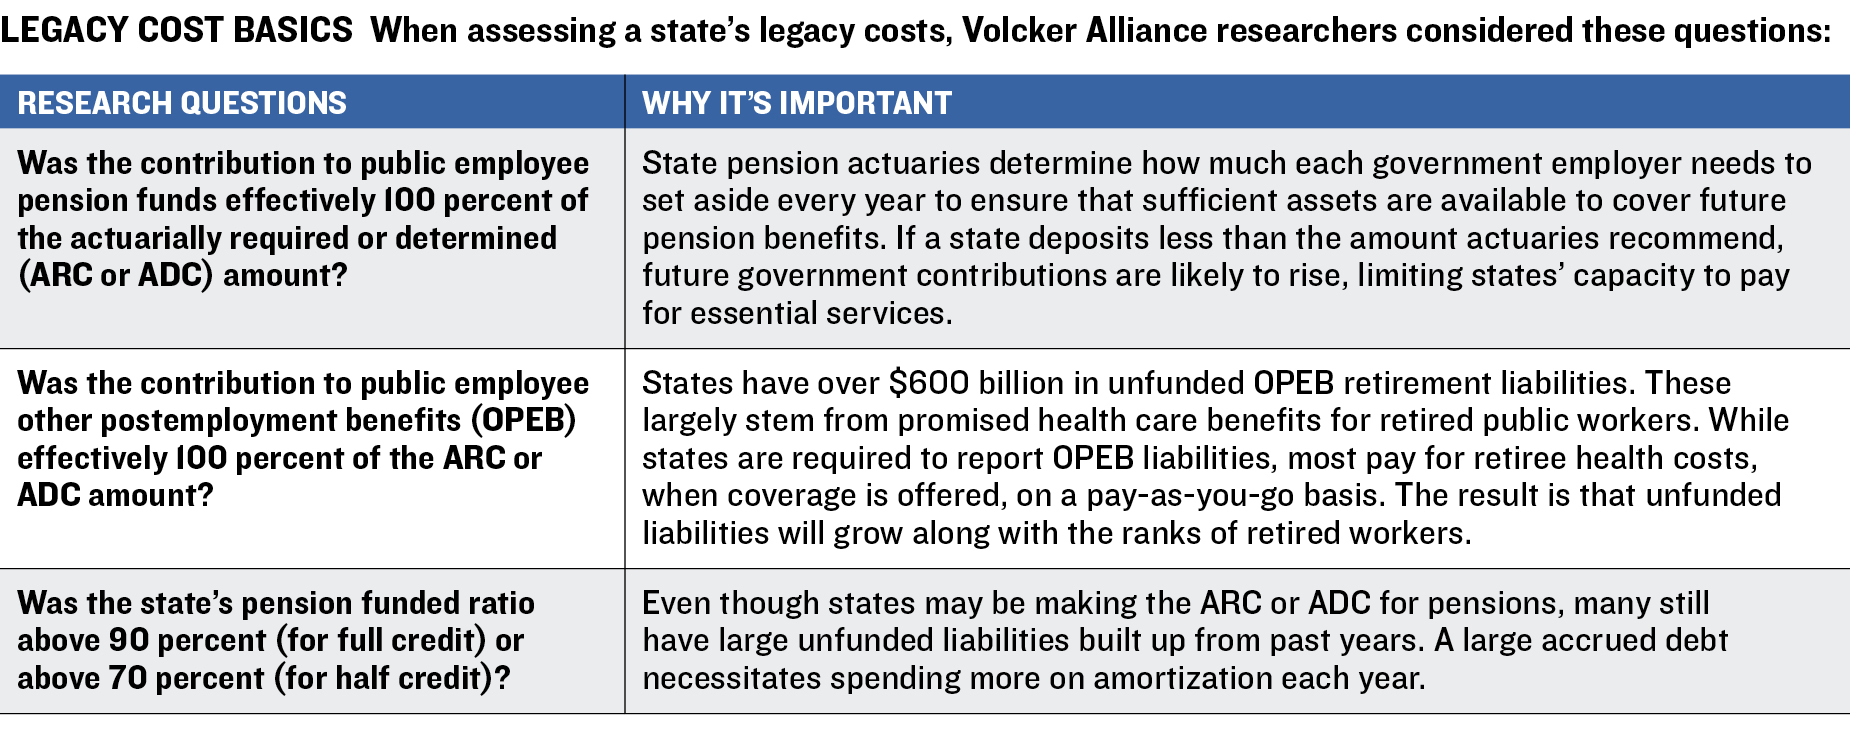
Legacy costs. States should consistently make contributions that actuaries recommend for public employee pension and retiree health care benefits. Those failing to make such contributions for long-term benefits are likely to see increasing pressure on budgets as the costs of paying off their long-term liabilities rise and crowd out spending for essential services. Grades in this category depended on states’ success in providing actuarially determined pension and other postemployment benefits (OPEB) contributions, as well as on how adequately their pensions were funded. The average mark was C, with thirty-three states at that level or below.
Reserve funds. States should enact clear policies for rainy day fund deposits and withdrawals and adjust fund levels for the historical volatility of their revenues. The average grade was B.
Transparency. States should provide the data that public officials and citizens need to understand budgets. This includes online disclosure of budgetary information; public reporting of the scope and cost of tax expenditures, such as exemptions, credits, and abatements; and reporting of the cost of deferred infrastructure maintenance. The average grade was B.
In 2015, Paul Volcker, the former Federal Reserve chairman and founder of the Volcker Alliance, observed that fiscal pressures on many states had encouraged them to “shift current costs onto future generations and push off the need to make hard choices on spending priorities and revenue practices.”17 While many states were able to strengthen budgetary practices during the record-breaking US economic recovery that ended in 2020, shifting the cost of providing current services to the next year or decade remains as pressing a concern as ever.
As described in this and other studies published by the Volcker Alliance, the at least $1.3 trillion in states’ unfunded liabilities for pension benefits for public workers is perhaps the largest example of such deferrals, as is the estimated $1 trillion worth of deferred maintenance on publicly owned infrastructure.18 Pressure to maintain budgetary balance in the face of fiscal burdens resulting from the COVID-19 pandemic may only accentuate states’ desire to engage in the cost-shifting practices that Mr. Volcker described.
In previous reports, we have maintained that it would be easier for states to balance budgets transparently if they were to adopt the modified accrual form of budgetary accounting instead of the cash-based method in general use. Because cash accounting recognizes budgetary expenditures only when bills are paid, governments can commit to spending yet declare budgets balanced by deferring cash outflows until checks are cut. Modified accrual accounting is more conservative. Used most notably by New York City after 1975, when it nearly declared bankruptcy, the technique requires recognition of promised payments when liabilities are incurred. The method is recommended by the Governmental Accounting Standards Board for municipal financial statements, including comprehensive annual financial reports. Adoption of modified accrual for budgeting would eliminate many one-time maneuvers and lead to genuinely balanced budgets.
Whatever accounting method states use, budgetary decisions should be informed by a broad array of data about the budget process and guidelines for sustainable fiscal practices. The five building blocks detailed in this report, as well as its predecessors, are a starting point for this informed analysis.
Areas of Analysis
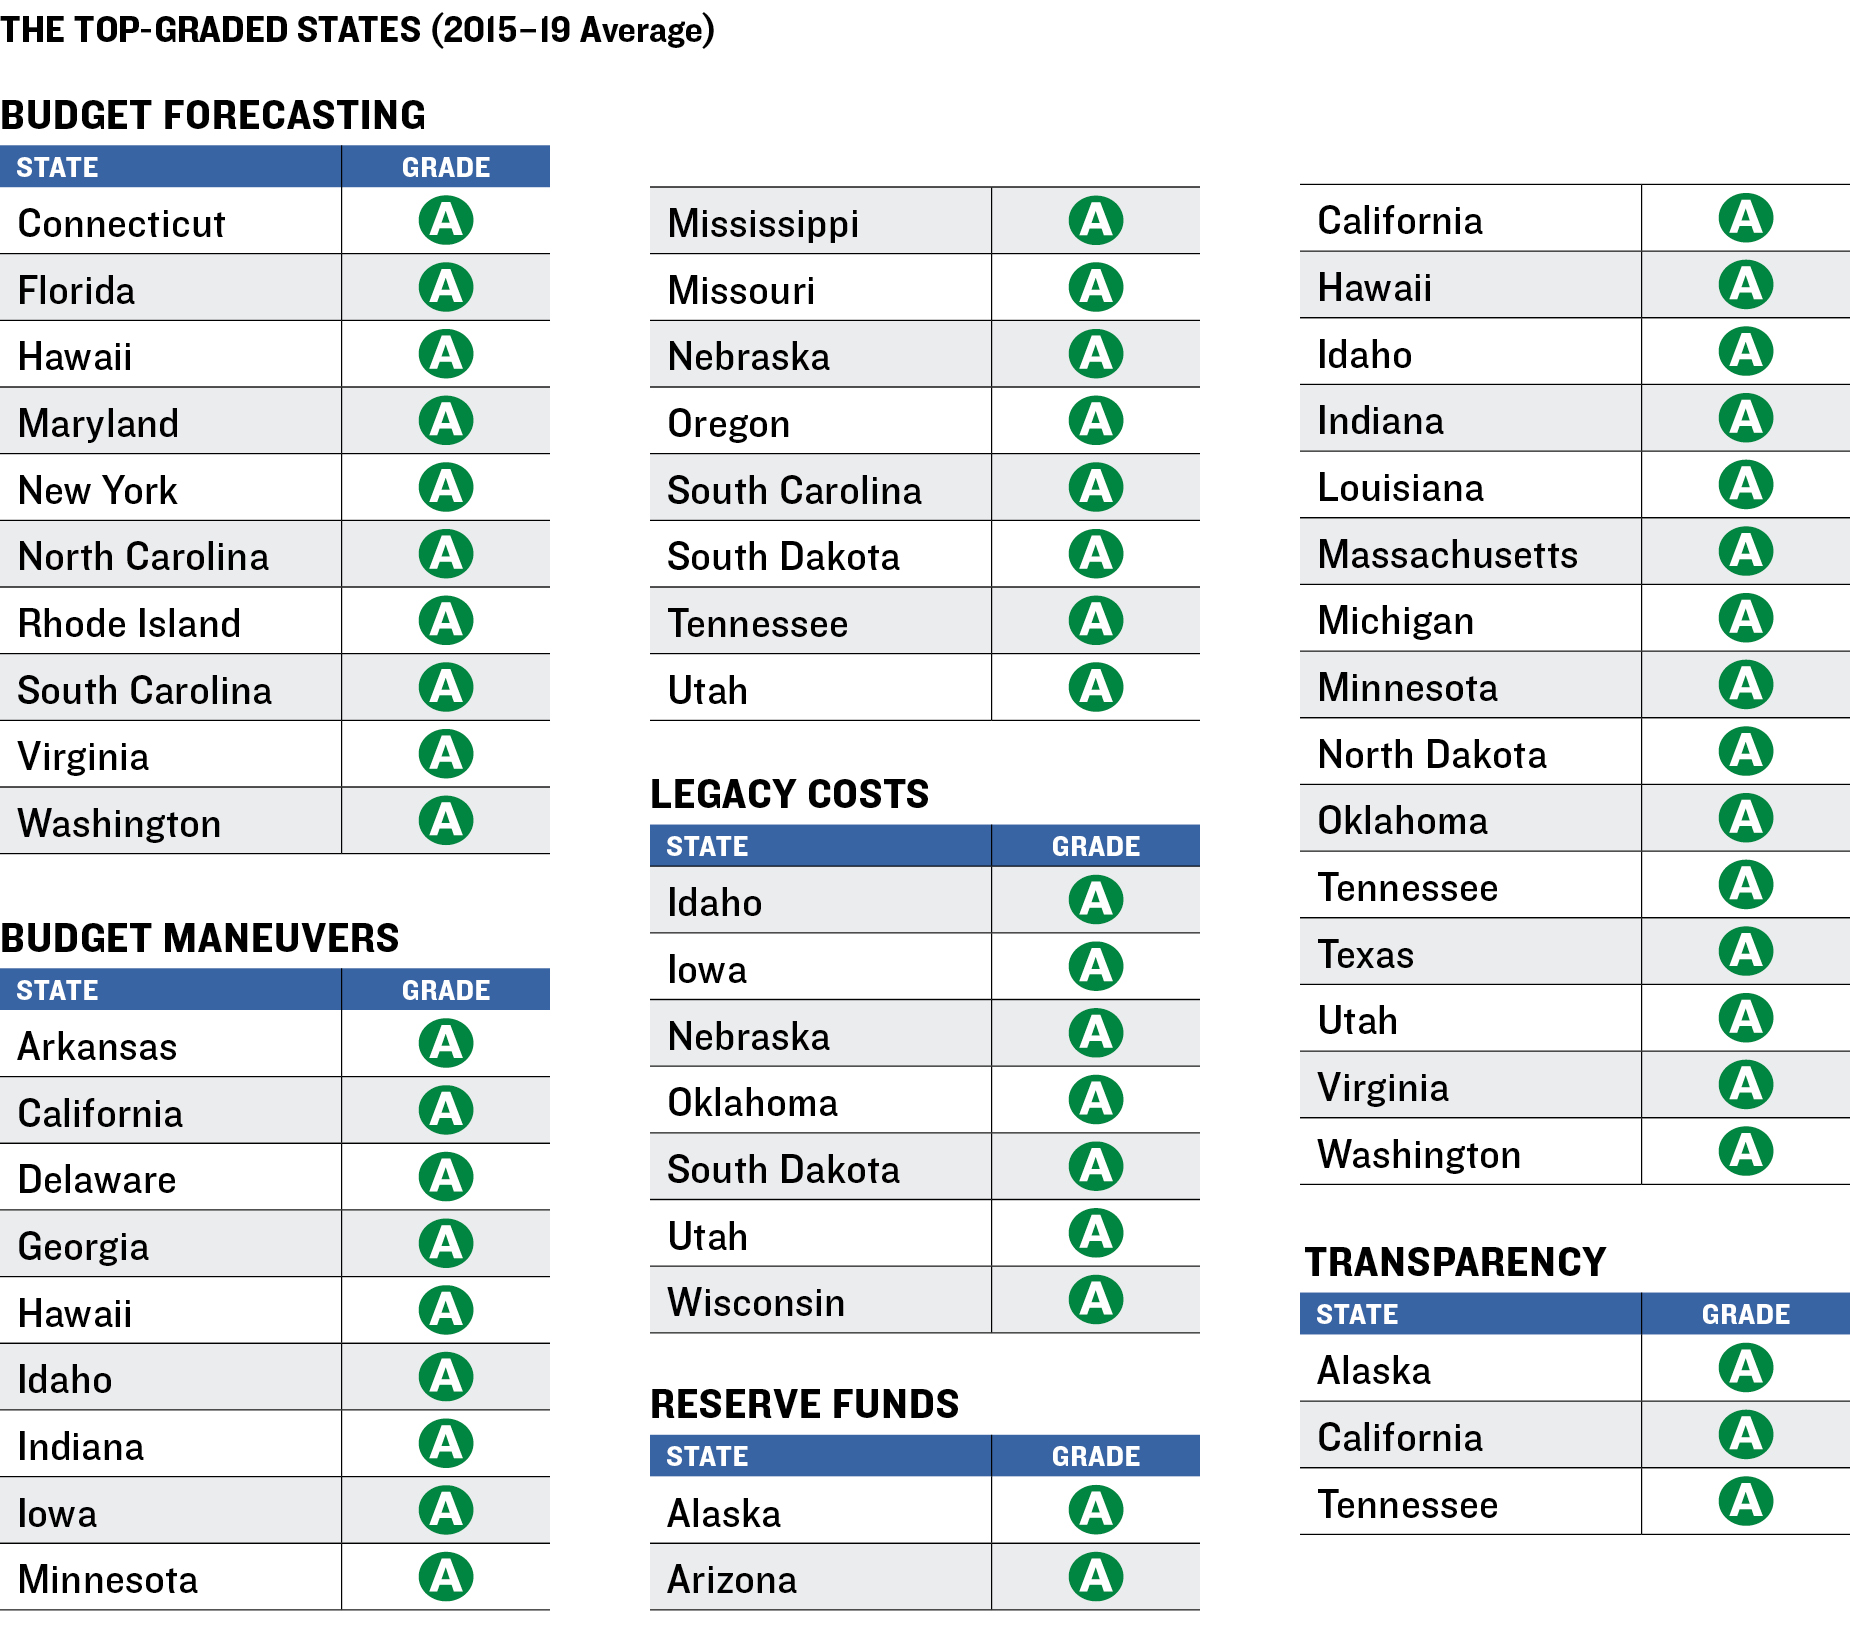
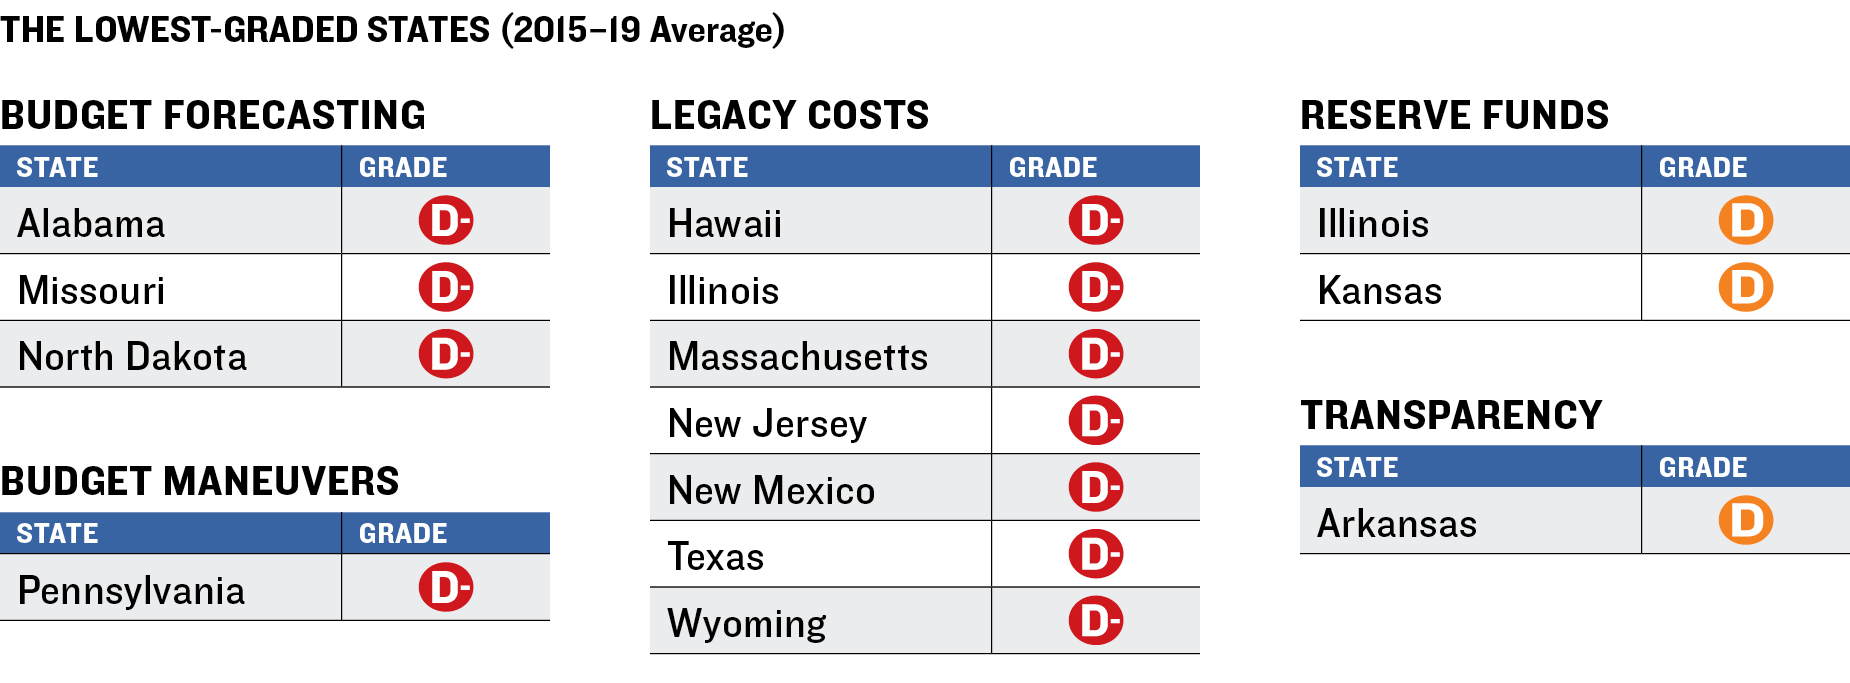
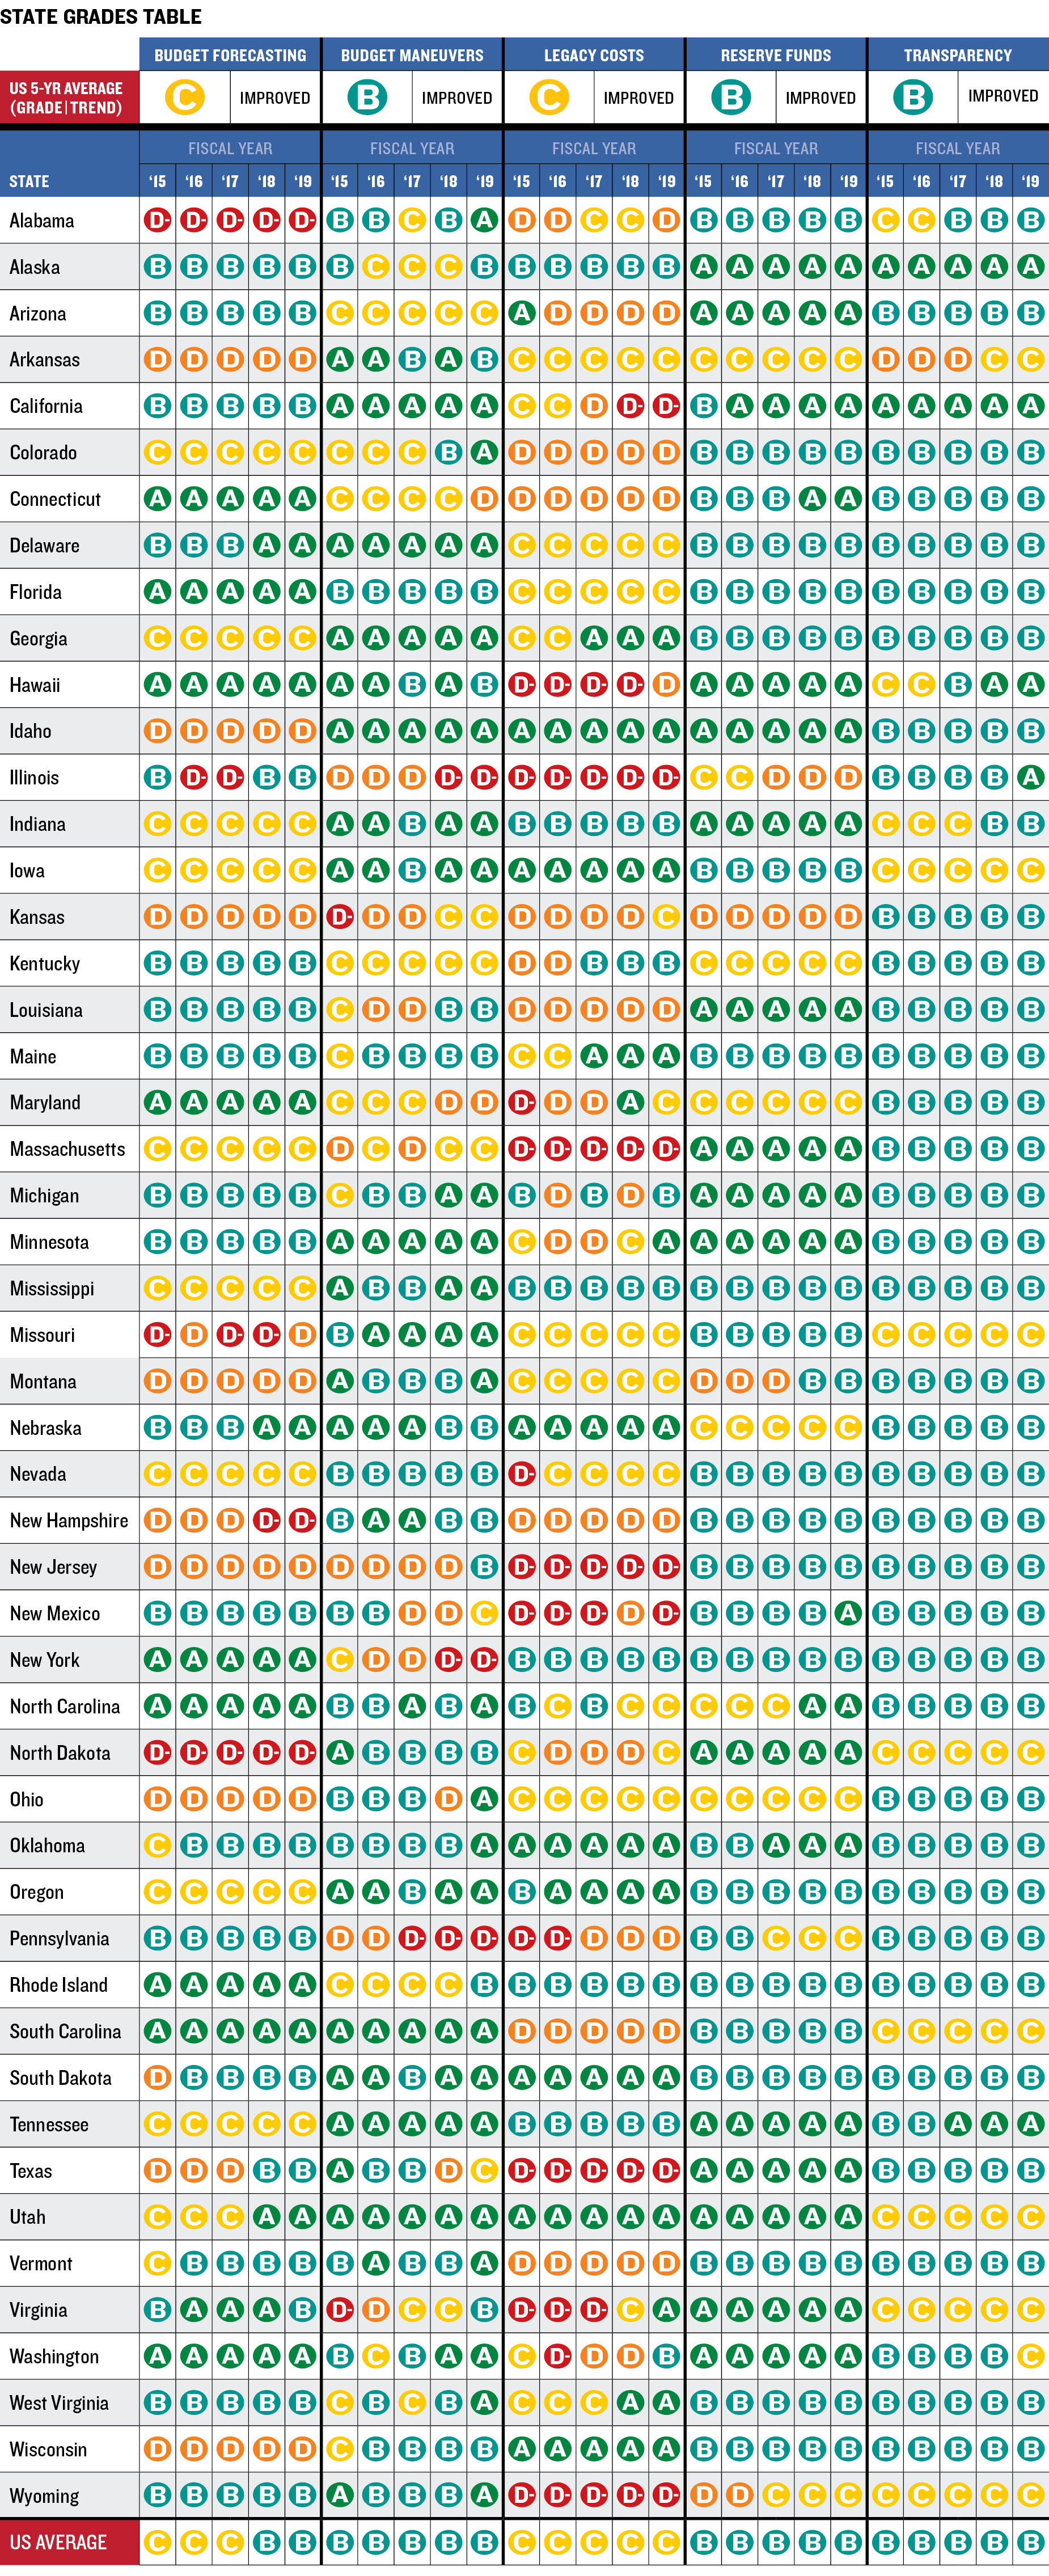
Grades assigned to states in each of the five budgetary categories reflect their annual and five-year average performances for fiscal 2015 through 2019. On average, states were graded B in three areas and C in the other two. These are the categories in which the all-state average was B:
Budget maneuvers. While the overall mark was B, the record economic recovery buoyed tax revenues in the five-year study period and enabled seventeen states to achieve top A averages by largely avoiding the use of one-time actions to achieve balance. Only one state, Pennsylvania, was given the lowest grade possible, D-minus, for the study period.
Reserve funds. The recovery also helped many states strengthen rainy day funds and other emergency reserves. Seventeen won A averages and only two—Illinois and Kansas—averaged Ds because of policy deficiencies. None was graded D-minus.
Transparency. A lack of reporting on deferred infrastructure maintenance costs held down states’ overall performance, with only three—Alaska, California, and Tennessee—averaging A marks for the period. Arkansas, which was penalized for its lack of comprehensive online budgetary disclosure, was the lowest-graded state, with a D average.
These are the categories in which the all-state average was C:
Budget forecasting. Grades were restrained by a lack of estimates prepared jointly by governors and legislators, as well as by an absence of long-term revenues or expenditures in many states during the study period. Only ten states averaged As, while three, Alabama, Missouri, and North Dakota, posted D-minus marks.
Legacy costs. Trillions of dollars in funding shortfalls in public worker pensions and OPEB, mainly health care, weighed heavily on the category. Only seven states merited A averages. Seven received D-minus marks, the most in any category.
Following is a discussion of the results in each of the evaluated budget categories.
Budget Forecasting
Whether enacted annually or every other year, budgets should ensure that state governments maintain balance between the amount coming into the general fund and the amount going out. (Thirty-one states have annual budgets; nineteen use biennial ones.)19
Preserving budgetary balance can be difficult when states lack strong processes for forecasting revenues and expenditures in the coming year or biennium and, ideally, for multiple future years. Inaccurate forecasts can force states to cut spending or increase taxes unexpectedly or to resort to one-time actions to return the budget to balance.
Though forecasting sometimes refers to revenues exclusively, estimating the spending part of the equation is equally important. For example, understanding the affordability of tax cuts, without depending on borrowing or one-time revenues to finance them, is contingent on the state’s ability to estimate and control expenditures. Equally important is being able to estimate the impact of changes in the nation’s economy on state finances.
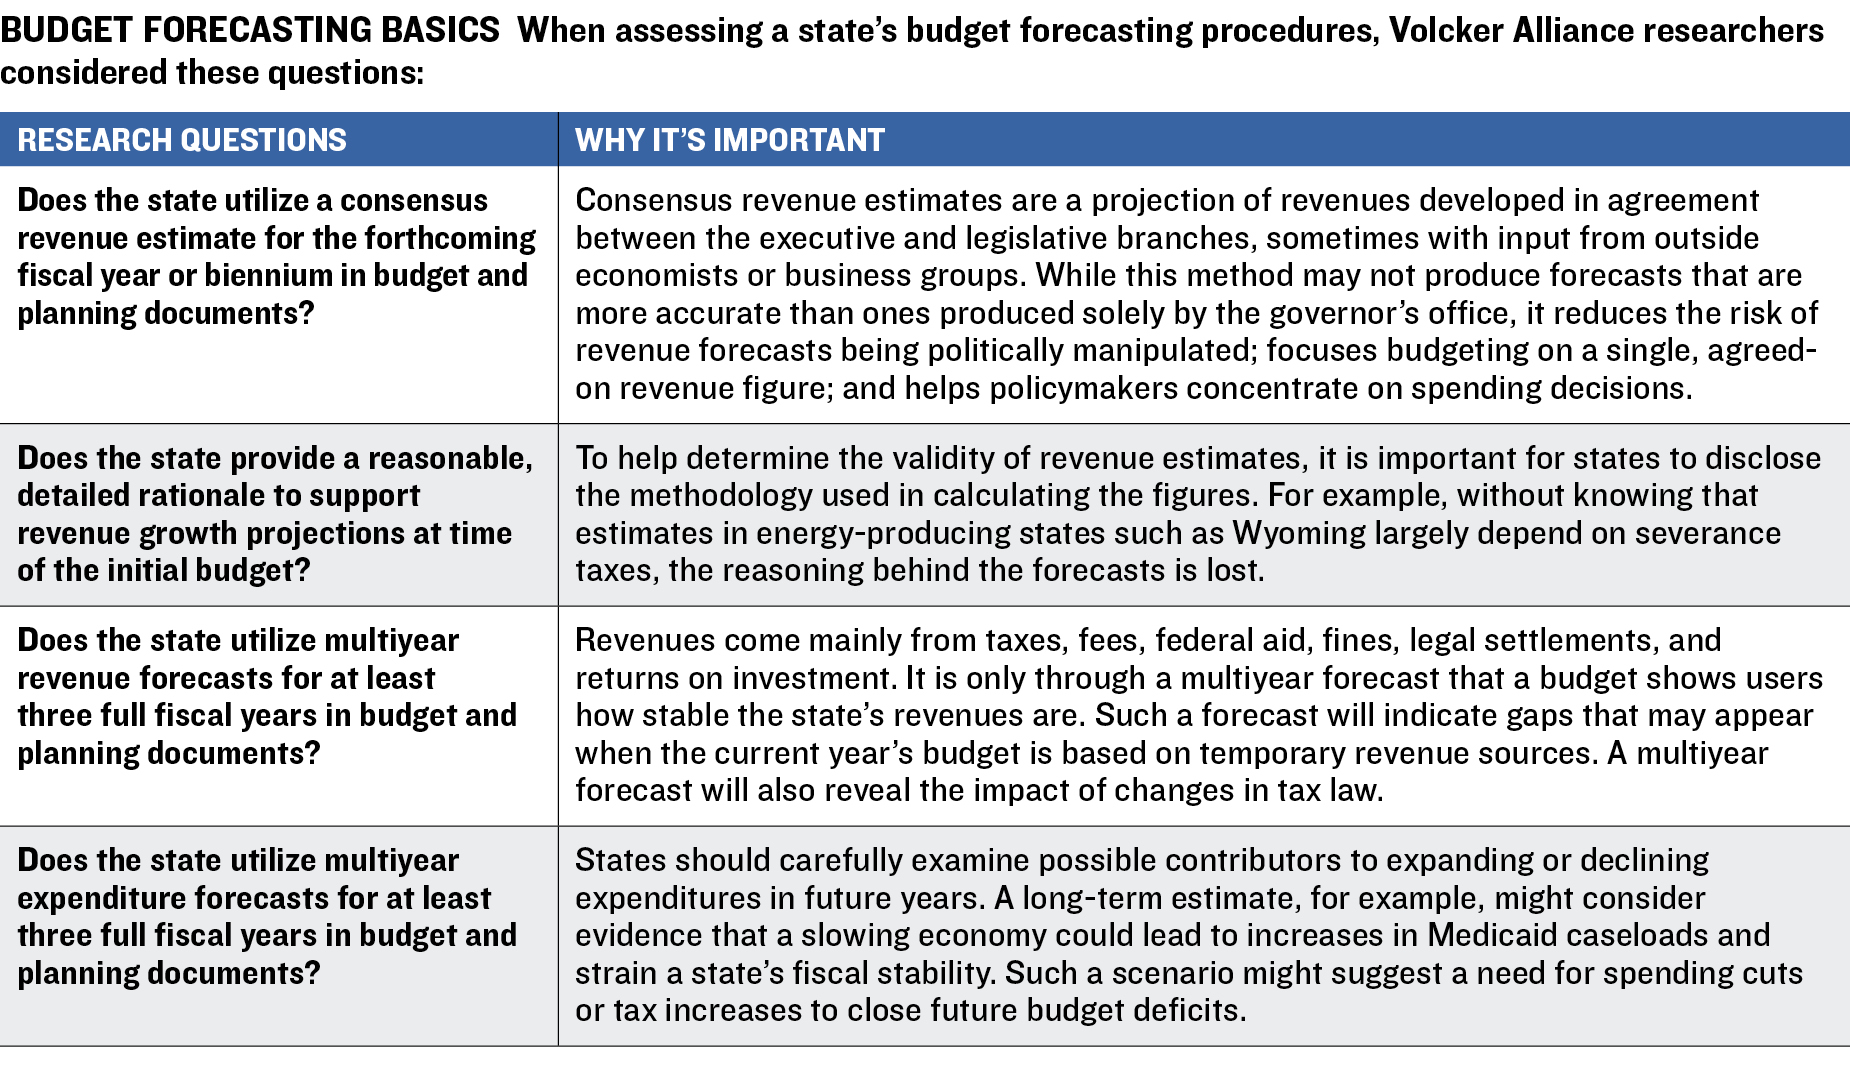
With these considerations in mind, the Volcker Alliance sought answers to four questions about the way states estimate future revenues and expenditures. The average five-year grade for the states in this category was C.
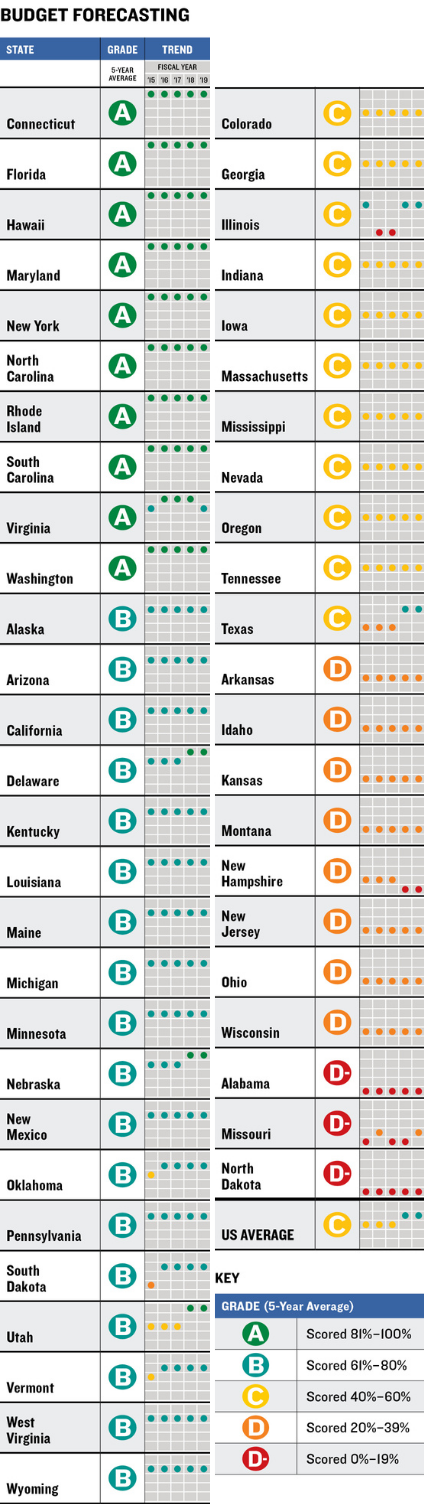
States that showed improvements in this category include Texas. Since fiscal 2018, the Legislative Budget Board has been required to provide the information necessary to make ten-year forecasts for revenues and expenditures, a somewhat longer period than in most other states.20 Whether similar long-term projections continue will depend on the legislature’s evaluation of the new process.
As a result of changes like this, the annual average in this category for all fifty states rose from a C in 2015, 2016, and 2017 to a B in 2018 and 2019.
This table contains assessments of the scope and quality of states’ budgetary forecasting for fiscal 2015 through 2019. States are graded on a scale of A to D-minus, the lowest possible mark, based on whether they used consensus revenue estimates for the coming year or biennium in budget documents; provided a reasonable, detailed rationale to support revenue growth projections at the time of the initial budget; utilized multiyear revenue forecasts for at least three full fiscal years in budget and planning documents; and utilized multiyear expenditure forecasts for at least three full fiscal years in budget and planning documents.
Budget Forecasting 5-Year Average Grades
Budget Maneuvers
A basic principle of successful budgeting is to pay for annual operating expenditures with revenues generated in the same year. Statutes or constitutional requirements in forty-nine states mandate that budgets must be balanced, while Vermont does so by long-standing tradition. But the ebb and flow of states’ economic and budget cycles may push them to use budget maneuvers, or one-time measures, to cover shortfalls.
When revenues lag or expenditures grow unexpectedly, for instance, states may balance budgets by delaying the payment of recurring expenditures into future years or using debt to cover operating costs. One commonly used budget maneuver involves transferring cash from special funds into the general fund. Forty states used this technique in at least one of the fiscal years studied from 2015 through 2019.
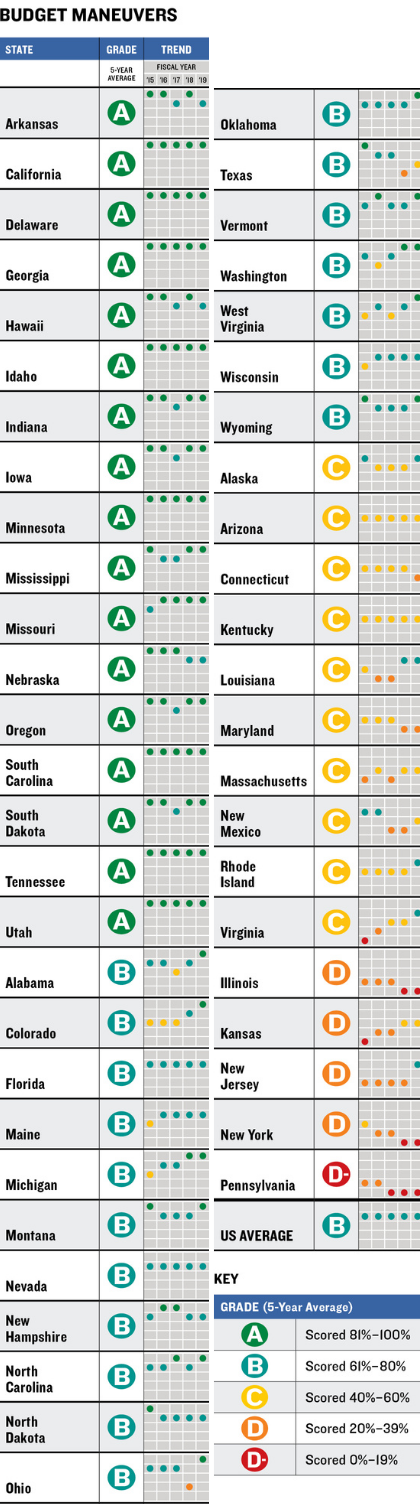
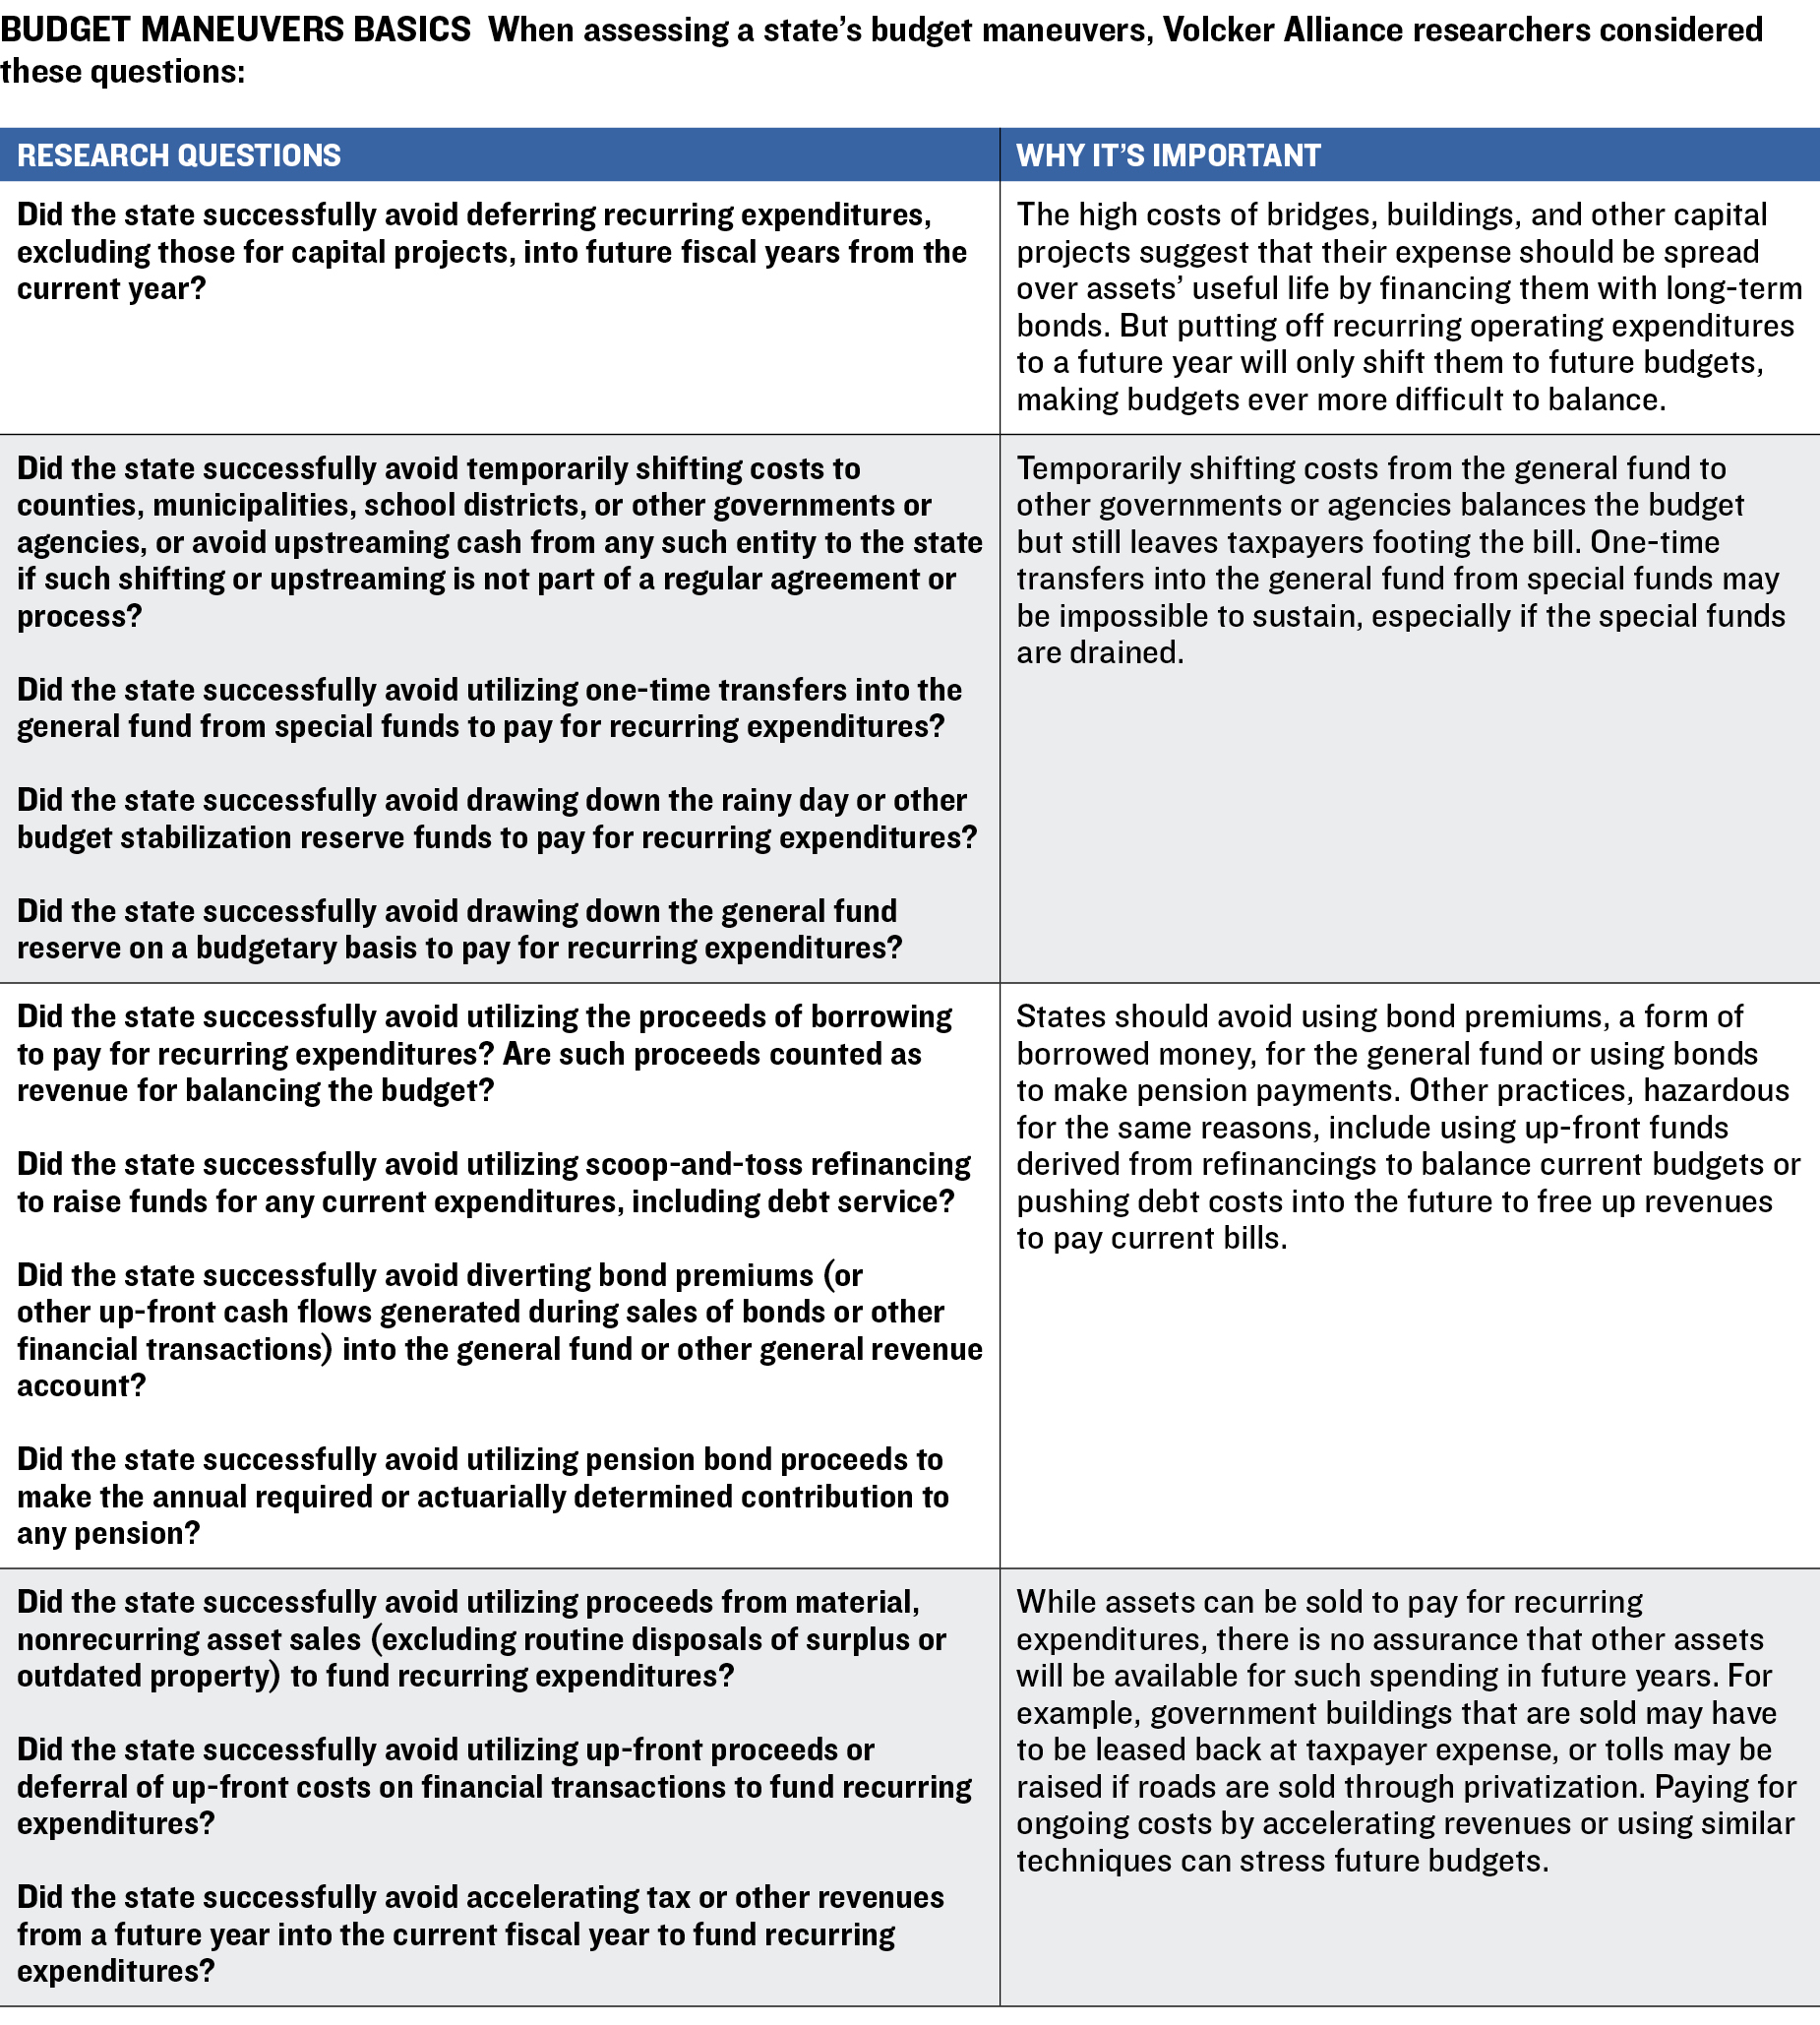
The Volcker Alliance posed twelve questions to gauge whether and how states used budget maneuvers. The average category grade for all states was B, with the use of one-time actions decreasing slightly amid the eleven-year economic recovery.
For example, Colorado, which averaged a B in the category, deferred expenditures in 2015–17 but weaned itself from the practice in the following two years. Louisiana, with an average of C, also showed improvements. In 2017, it used several tactics, including spending proceeds of a bond refinancing, to cover operating expenses. The state did not cover operating expenditures with debt in 2018–19.
This table contains assessment of states’ use of a range of one-time actions to balance budgets for fiscal 2015 through 2019. States are graded on a scale of A to D-minus, the lowest possible mark, on their successful avoidance of such techniques. They include deferring recurring expenditures (excluding those for capital projects) into future fiscal years; transfers from special funds to the general fund to cover recurring expenditures; temporarily shifting costs to other governments or agencies, or upstreaming cash from such entities that is not part of a regular process; using proceeds of borrowings, scoop-and-toss refinancings, diverting bond premiums into the general fund, or using bonds to make pension contributions; or using asset sales or other up-front cash flows from financial transactions to the general fund or similar accounts.
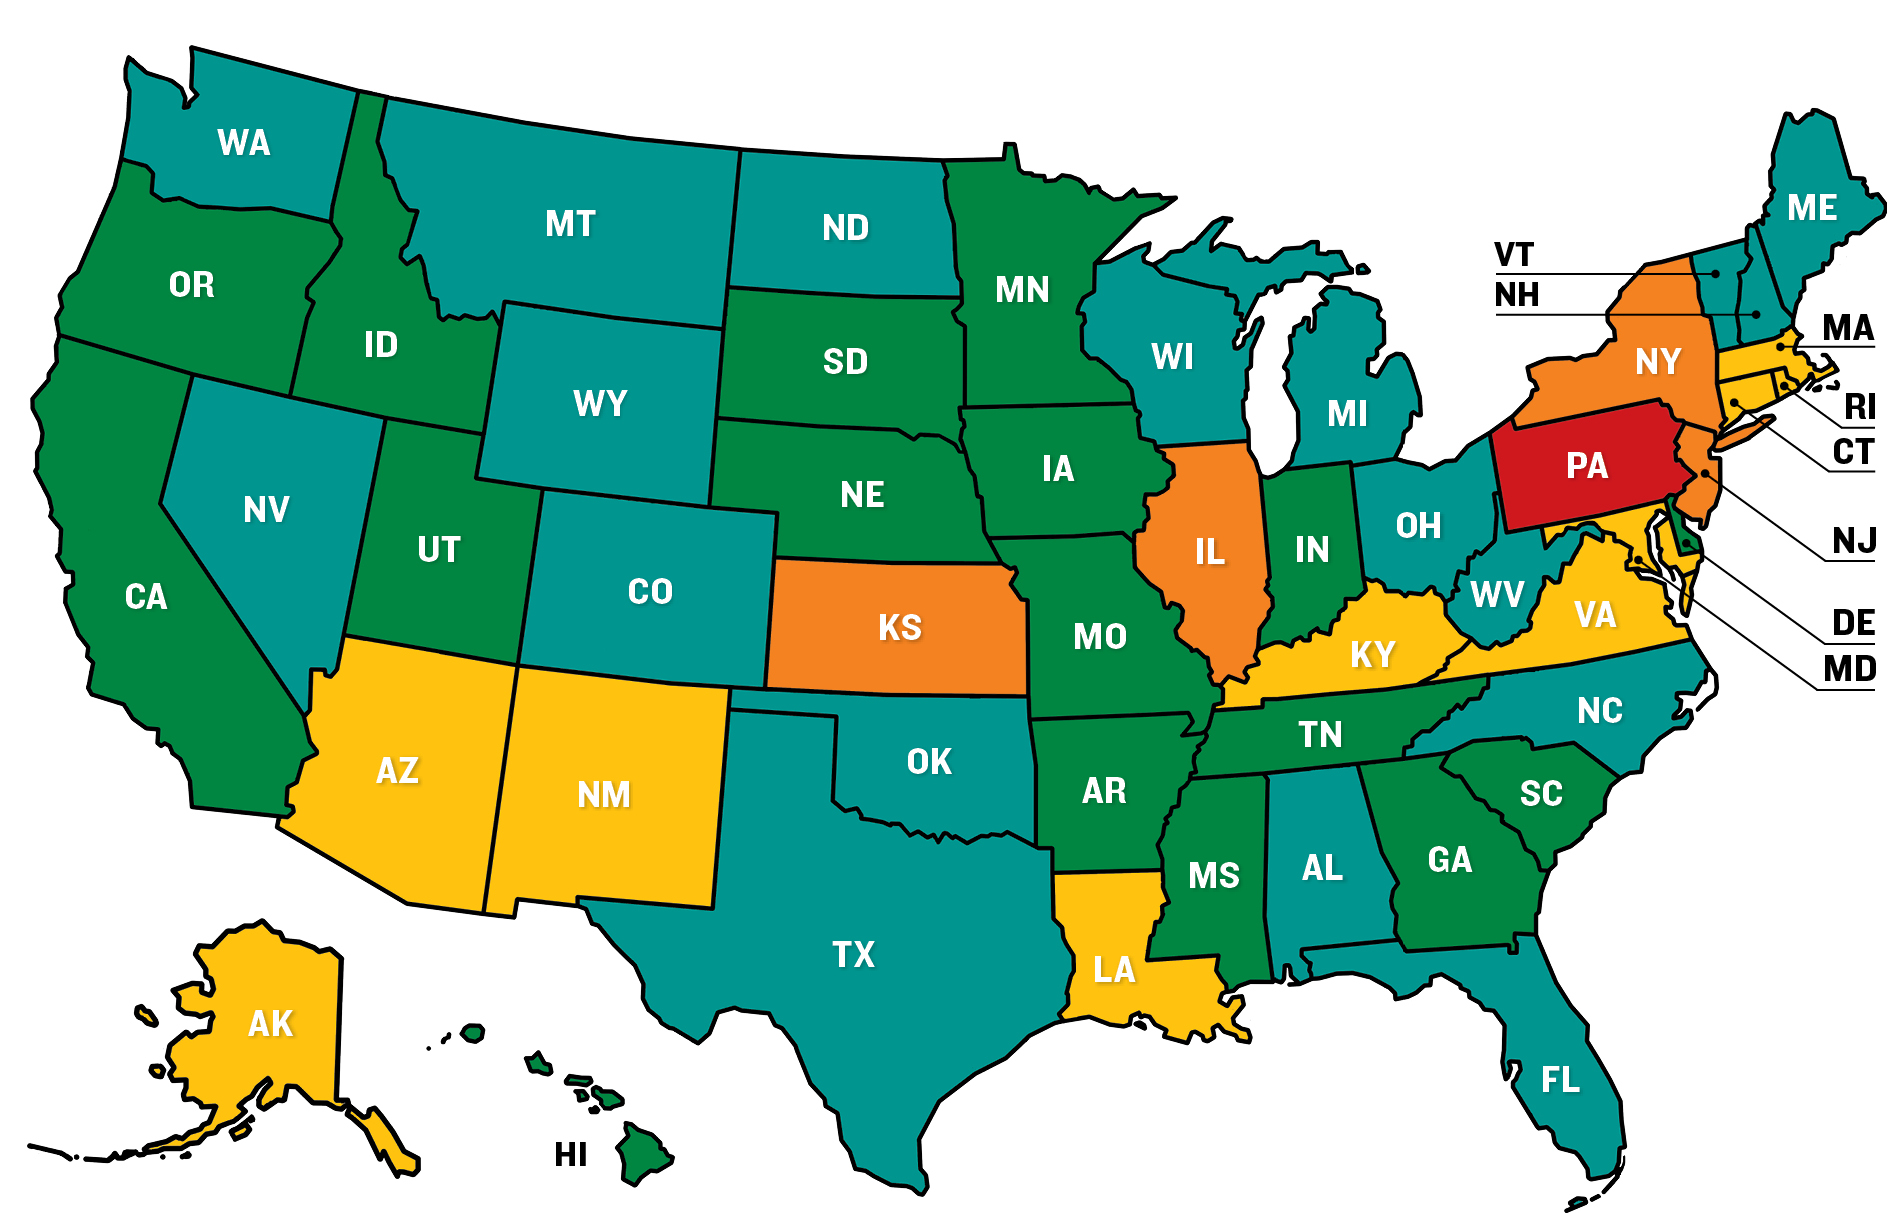
Budget Maneuvers 5-Year Average Grades
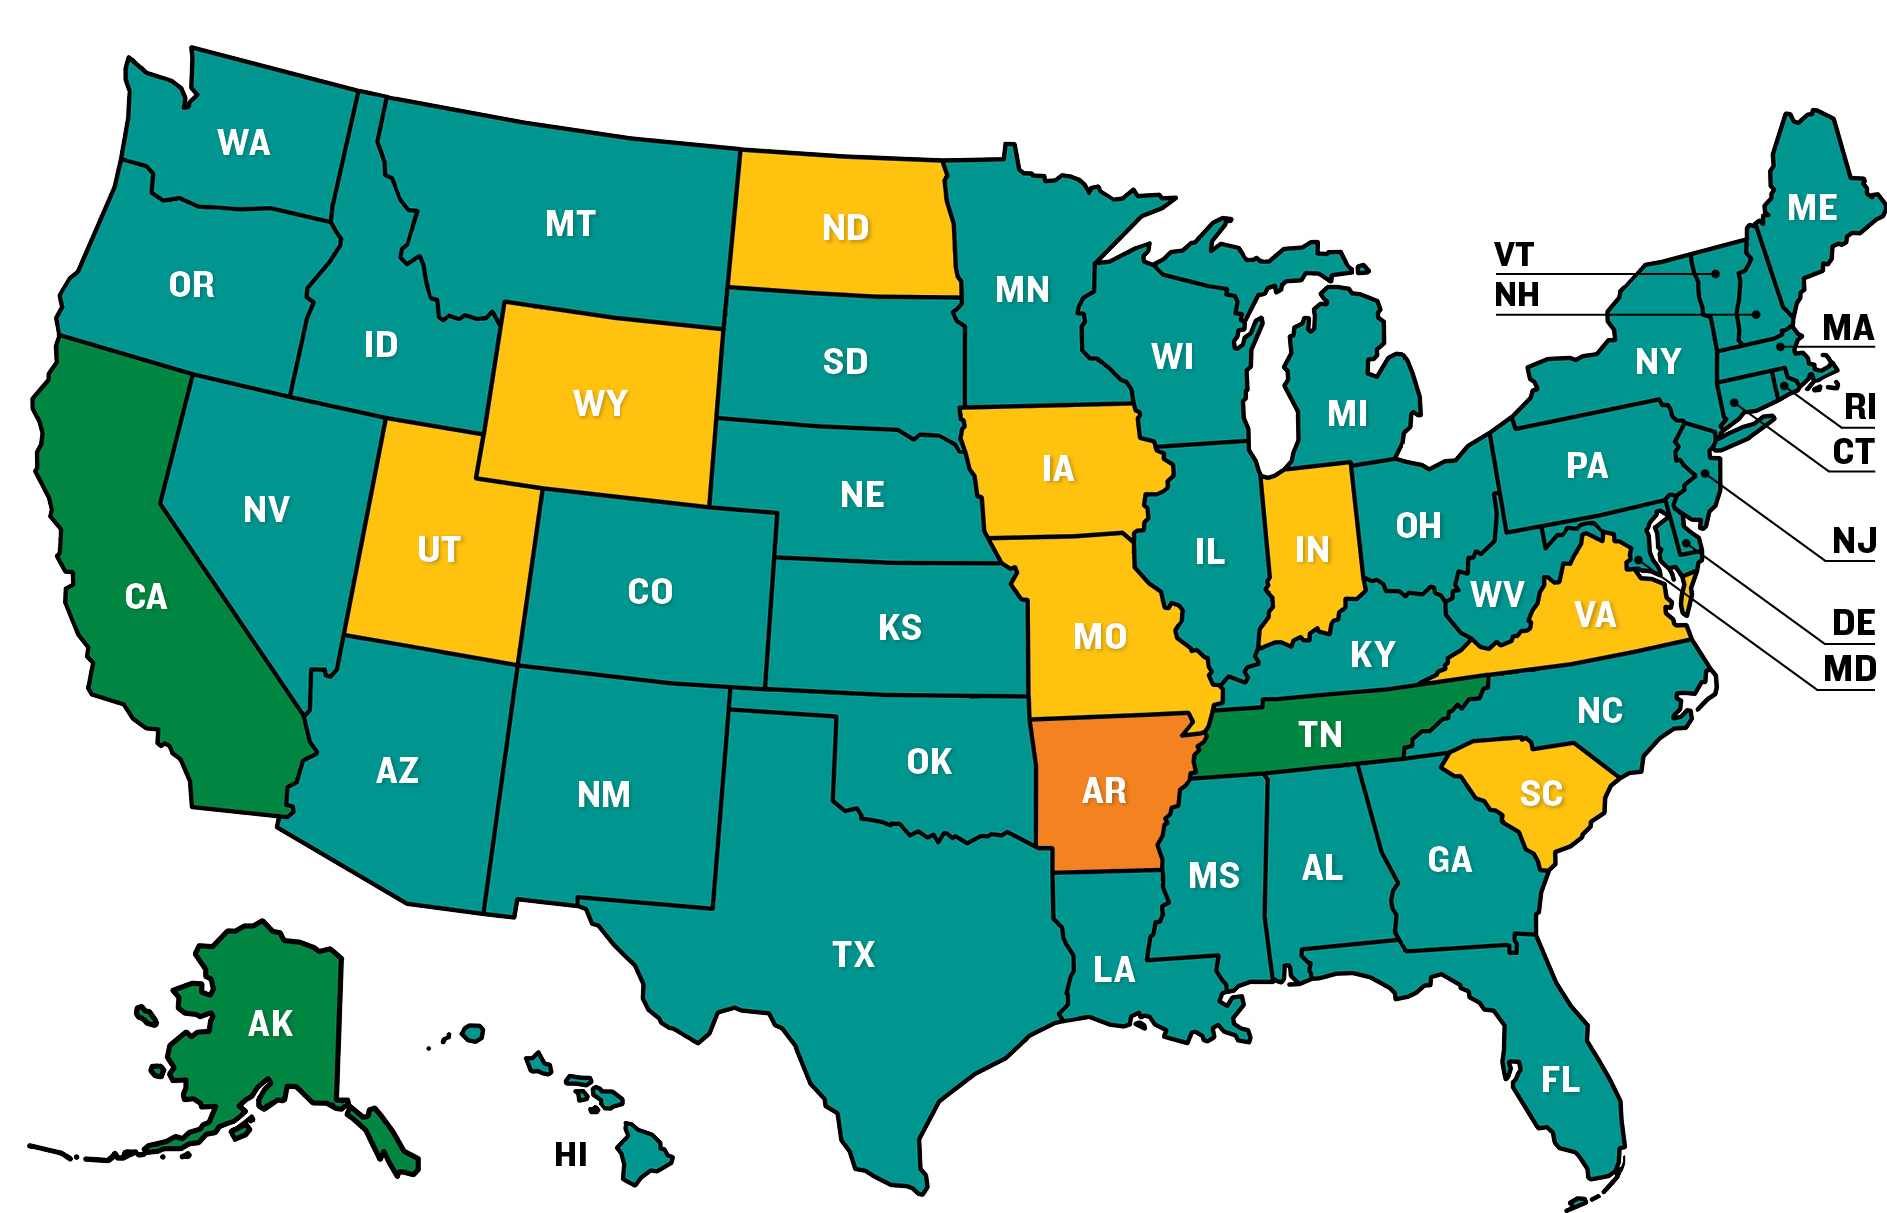
Legacy Costs
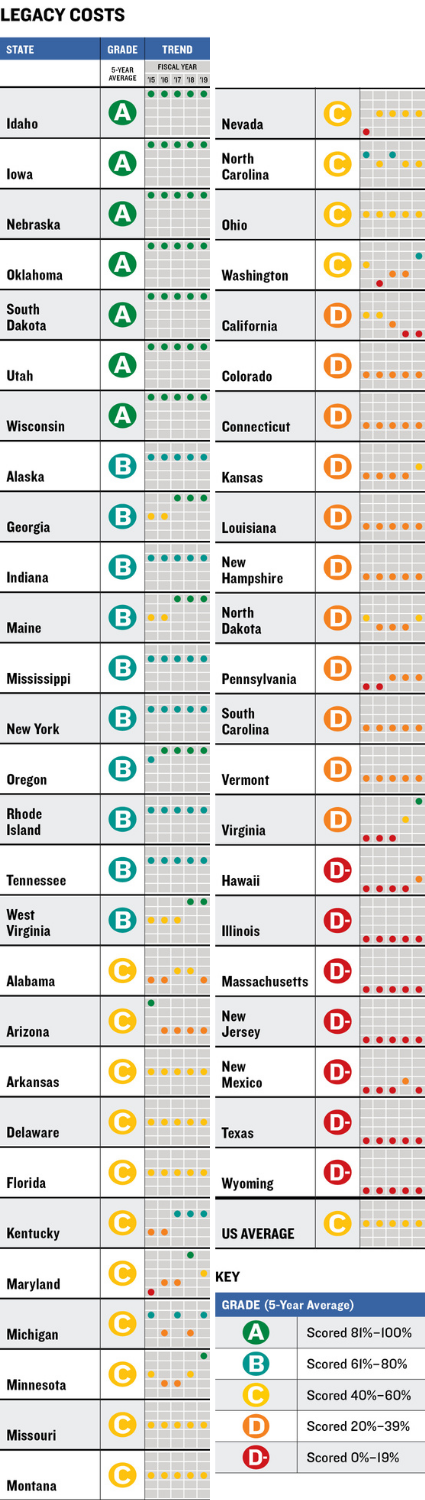
As growing revenues helped bolster revenues, the biggest fiscal issue that continued to confront states’ budgetary stability was the $1.3 trillion in unfunded liabilities that they had accumulated in public employee pension systems,21 in addition to over $600 billion in obligations for other postemployment benefits (OPEB), primarily health care.22
Even though the stock market’s robust gains from 2016 to 2019 also assisted in increasing funding for retirement plans, any significant market retrenchment will inevitably produce more funding challenges. That is of special concern to states ranking low in the Volcker Alliance’s assessment of how governments are dealing with legacy costs when they attempt to balance their budgets.
State and local governments have traditionally offered pension and other retiree benefits to attract and retain employees long term. Yet in weighing the need to fully fund pensions and OPEB against the need to maintain general fund spending on roads, schools, universities, and health care, states may end up taking shortcuts to achieve budgetary balance. When they decide not to pay the full amount that actuaries deem necessary to fund the promised retirement costs of current workers, along with liabilities run up for past underfunding, states push those costs—plus interest—onto future generations.
With these considerations in mind, the Volcker Alliance sought answers to three questions about the way states manage their legacy costs. The average grade for the states in the category was a C.
Some states have made progress. In 2017, for example, Georgia began funding its OPEB in line with actuarially defined contributions. In 2018, Minnesota benefited from an agreement with retired teachers and local government employees that helped cut the state’s unfunded pension liability by $3.4 billion.23 That helped bring its funding ratio from 63 percent in 2017 to 82 percent in 2018.
This table contains assessments of states’ ability to meet promises made to public employees for pensions and other retirement costs for fiscal 2015 through 2019. States are graded on a scale of A to D-minus, the lowest possible mark, on whether their contributions to public employee pension funds were effectively 100 percent of the actuarially required or determined contributions (ARC or ADC), adjusted for any unfunded liabilities; and whether their contributions to any public employee other postemployment benefit (OPEB) plans were effectively 100 percent of the ARC or ADC.
Legacy Costs 5-Year Average Grades
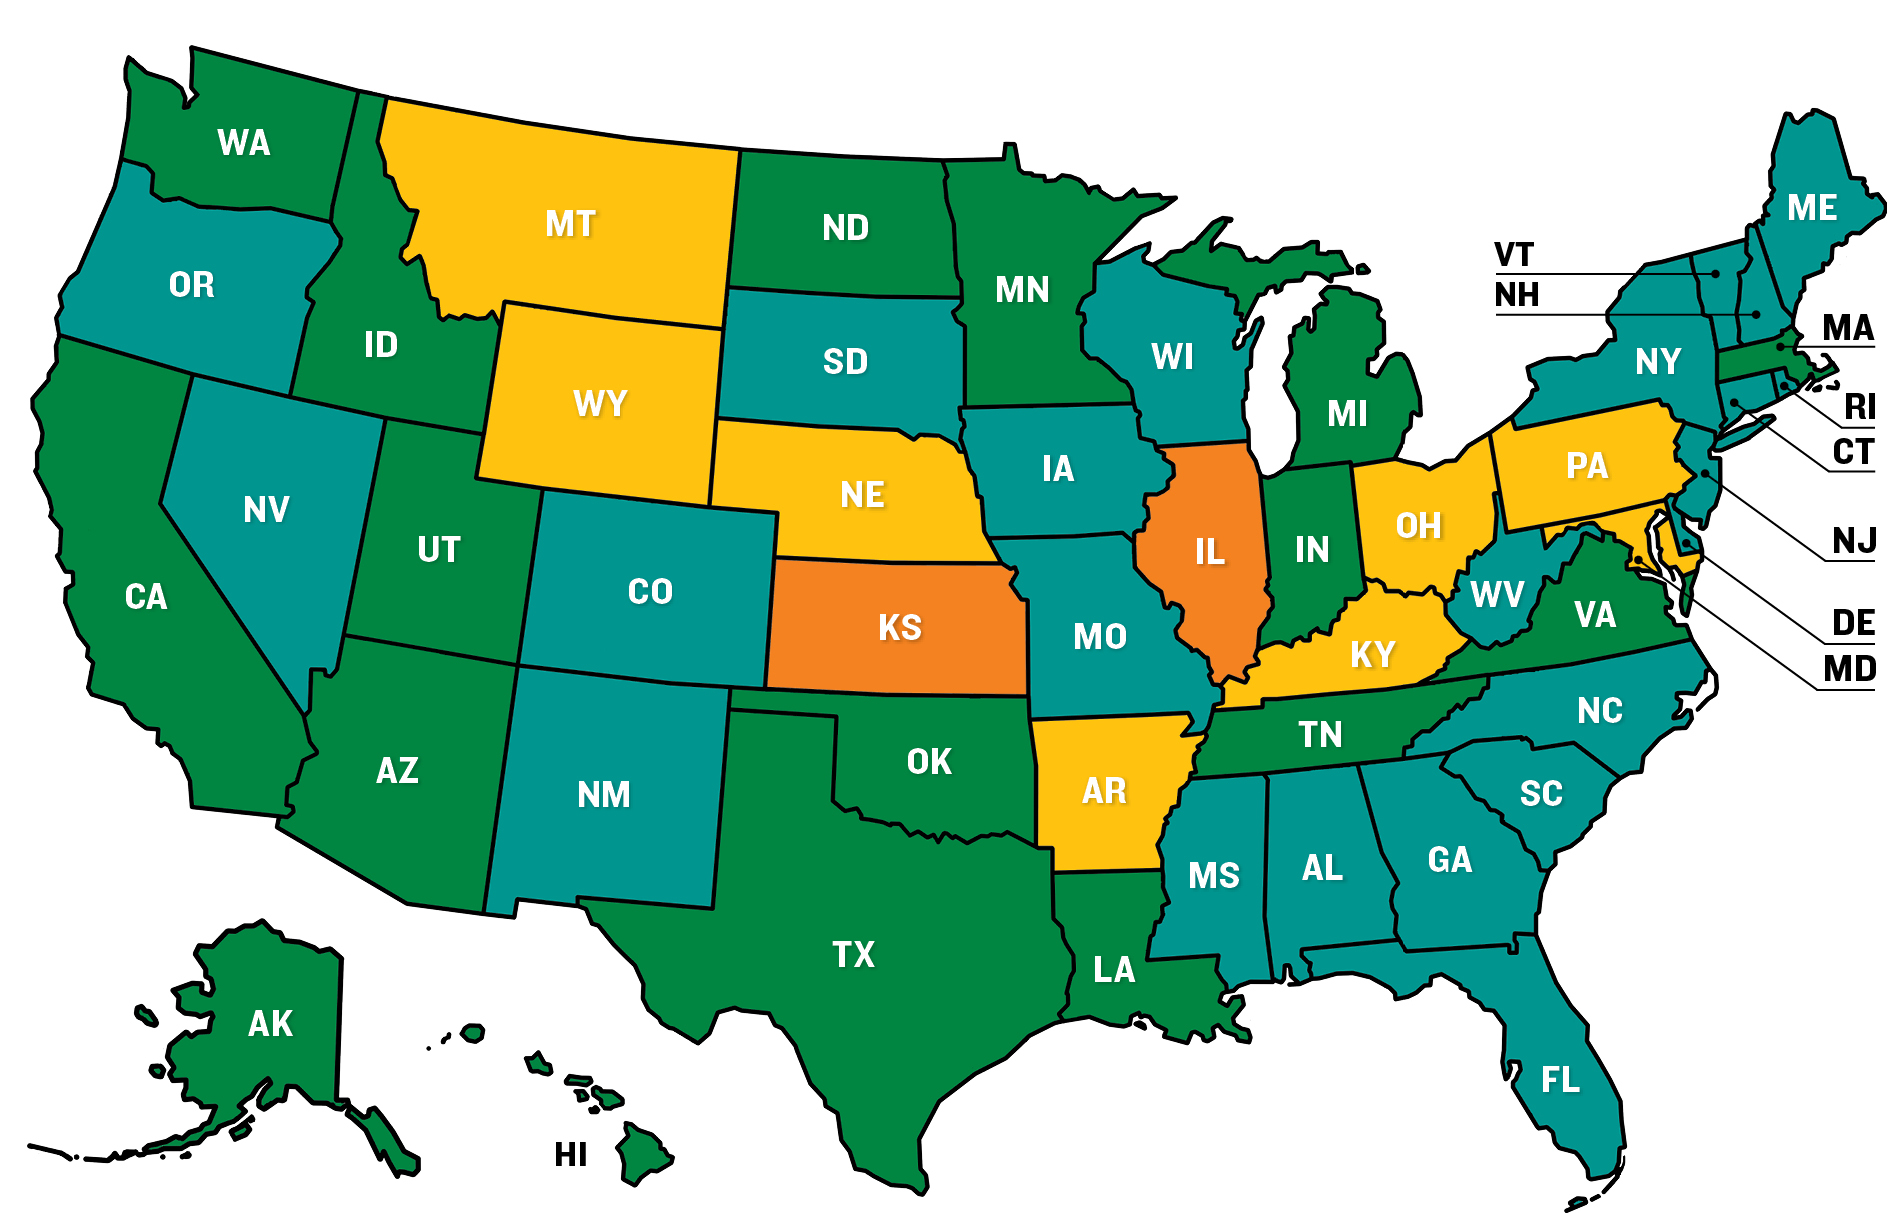
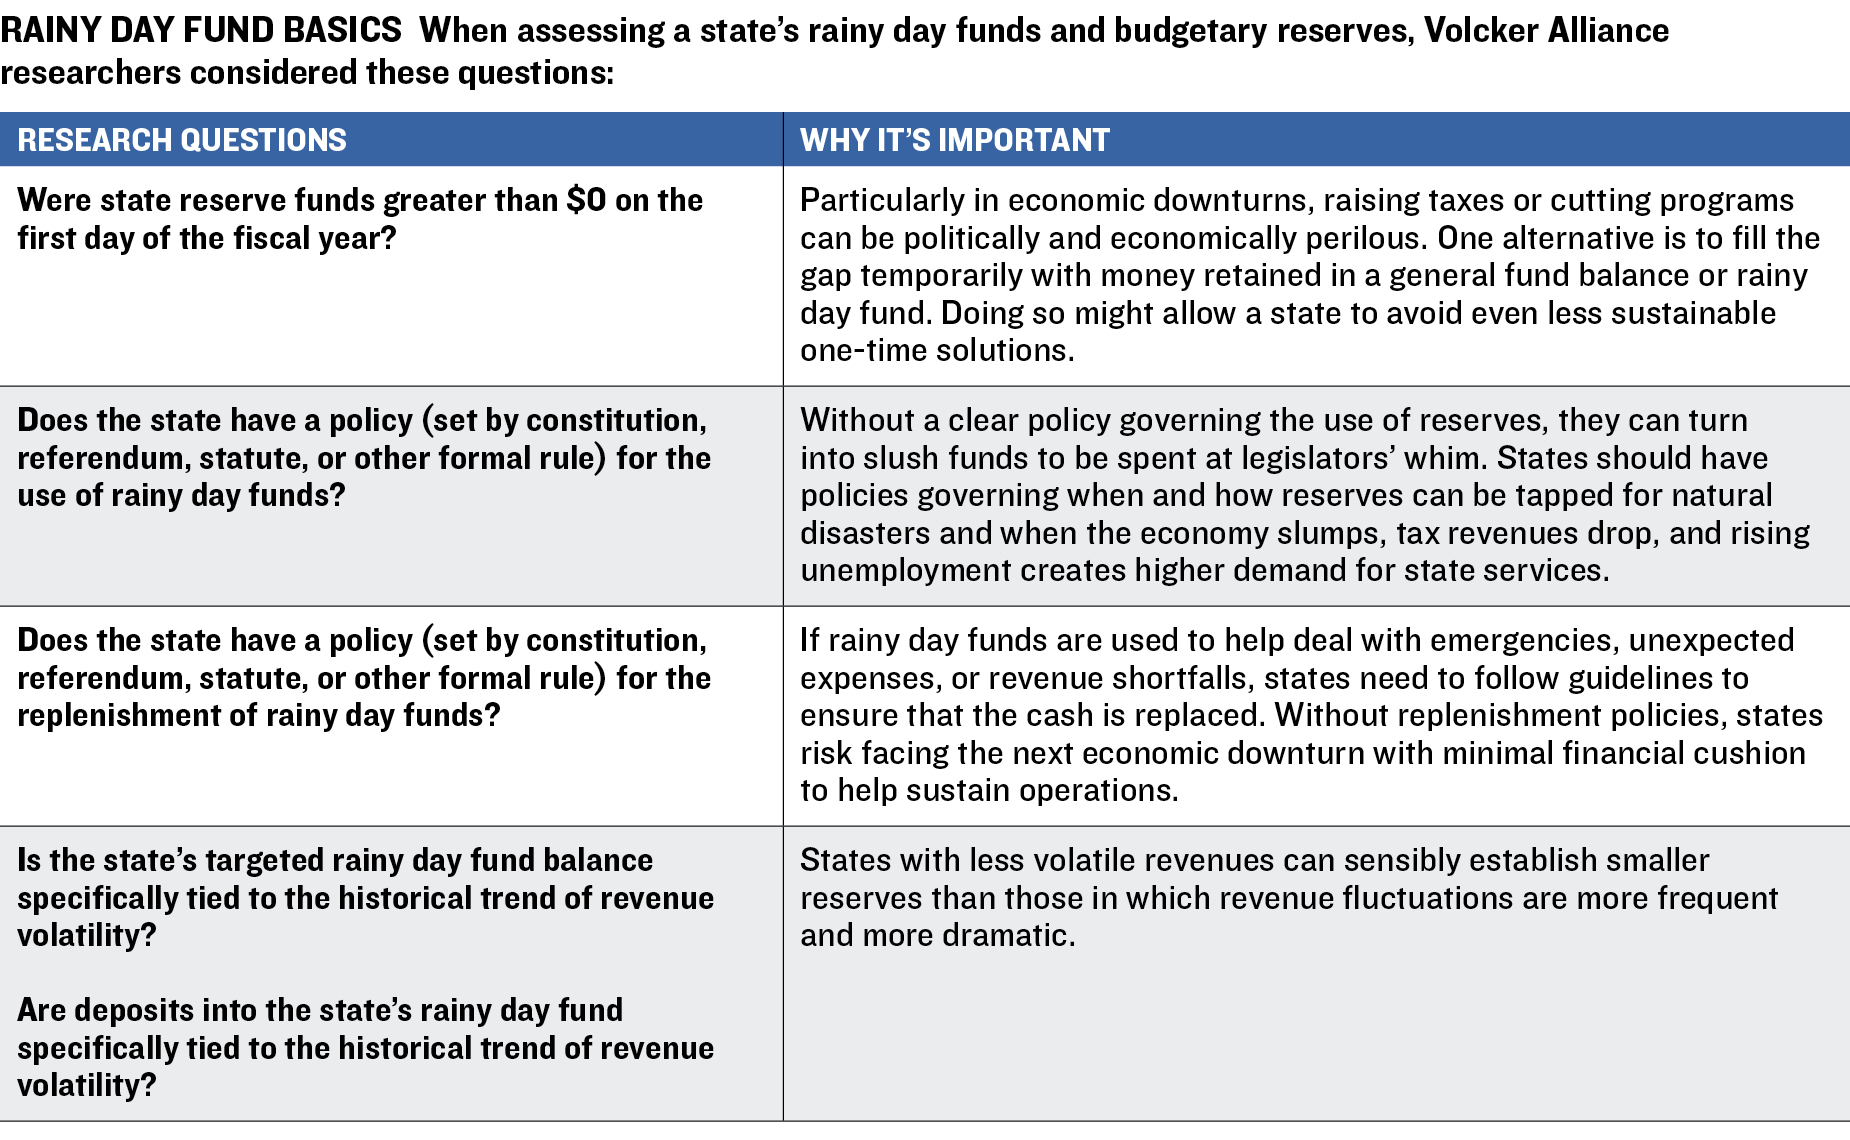
Reserve Funds
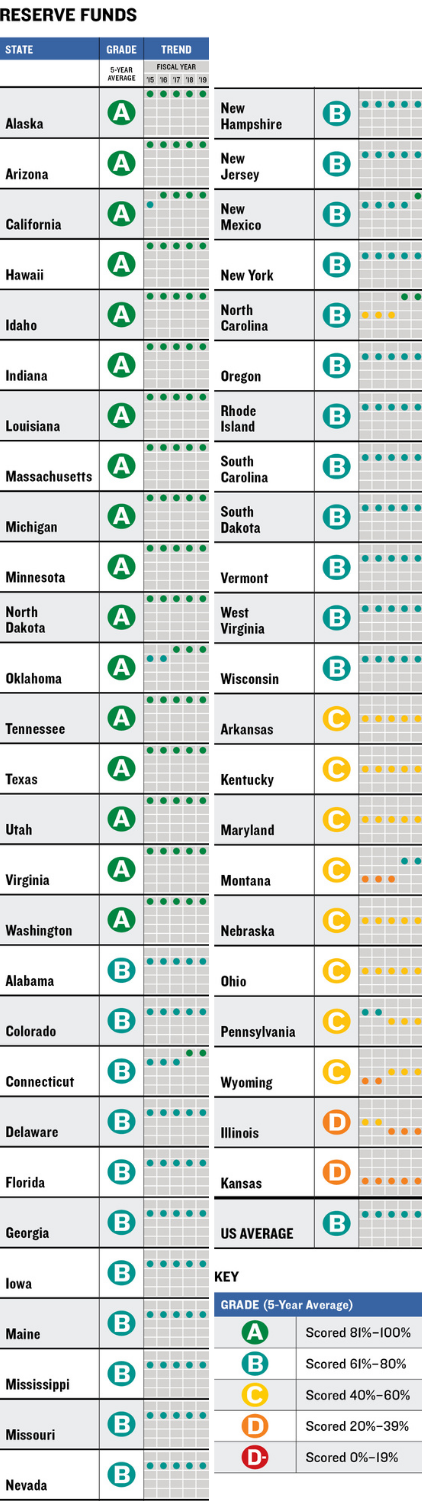
Rainy day funds—sometimes called budget stabilization funds—are an essential tool to help states weather the ups and downs of the fiscal cycle. Like positive general fund balances at the beginning of each fiscal year, rainy day funds contain cash purposefully set aside for states to turn to in fiscal or other emergencies. From 2015 through 2019, many states poured cash into these funds, putting them at an all-time high of $79 billion.24
The existence of a rainy day fund isn’t enough to ensure that it will be available to use when necessary, though. Setting conditions for withdrawals helps prevent elected officials from using these dollars to finance the politically popular program of the moment. Statutes or other rules about replenishing rainy day funds help ensure that they are refilled after they are tapped and that they keep growing until needed again.
It’s also helpful for states to tie rainy day fund deposits and balances to measures of revenue volatility. States that see wild swings in income are somewhat more likely to find themselves requiring extra dollars to help them when they are hit by nearly inevitable downturns in revenues.
With these considerations in mind, the Volcker Alliance sought answers to a series of questions about the way states manage their rainy day funds. The average five-year grade for the states in this category was a B.
North Carolina, with a five-year B average in this category, showed some of the most dramatic improvement. In 2018, it began to provide guidance for withdrawing money from its Savings Reserve Account, in addition to tying rainy day fund deposits to revenue volatility.25 As a result, its grade rose to an A in 2018 and 2019 from a C in each of the previous three years.
This table contains assessments of states’ balances and policies for reserve funds for fiscal 2015 through 2019. States are graded on a scale of A to D-minus, the lowest possible mark, on whether they had policies (set by constitution, referendum, statute, or other formal rule) for the use and replenishment of rainy day funds; whether the rainy day fund balance (or contribution) was specifically tied to the historical trend of revenue volatility; and whether the rainy day fund or general fund balances were greater than zero on the first day of the fiscal year.
Reserve Funds 5-Year Average Grades
Transparency
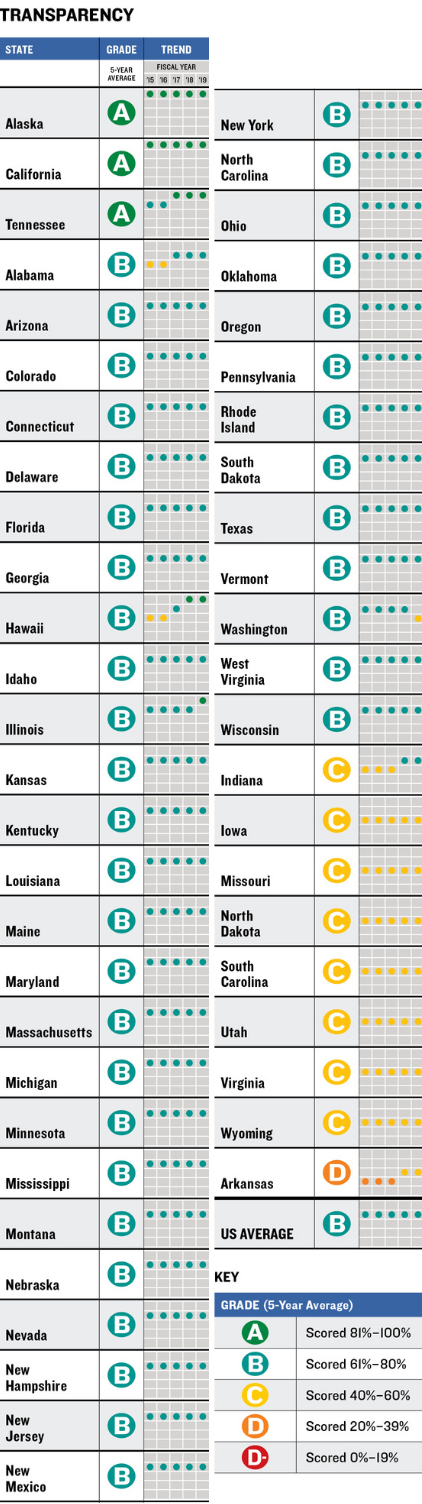
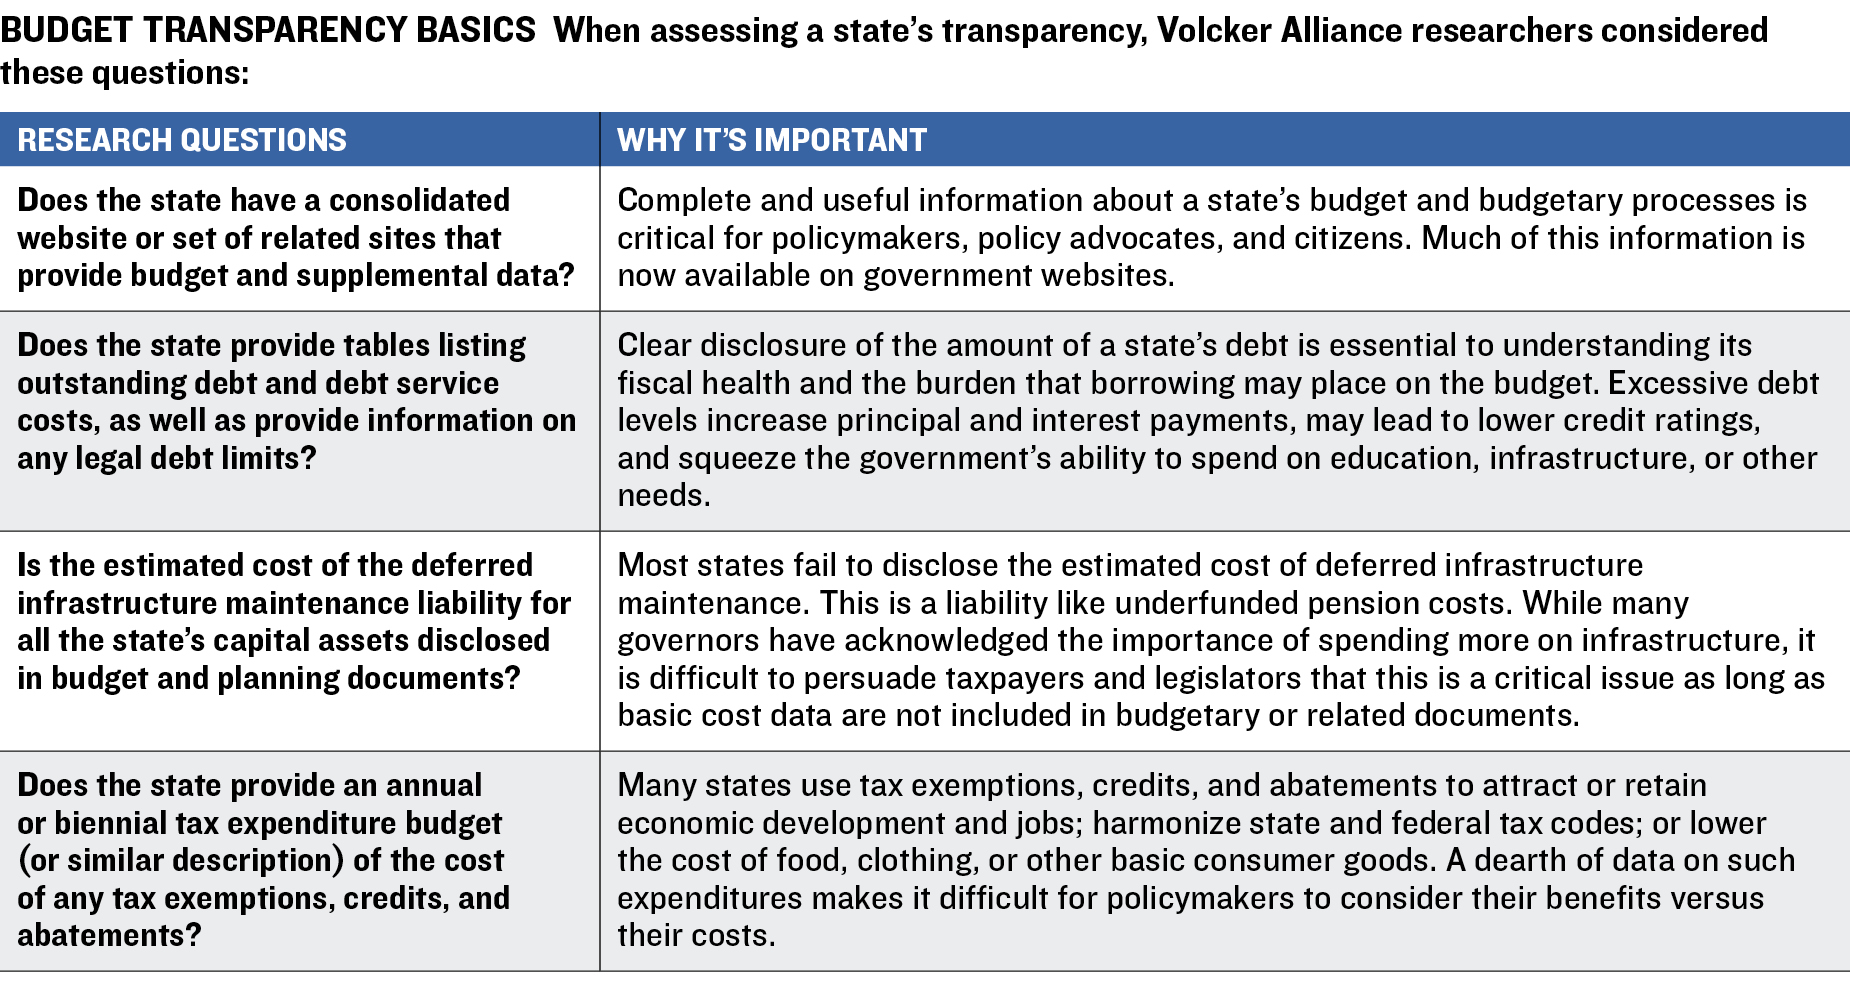
States must disclose more than revenues and expenditures for policymakers, advocates, and citizens to understand the risks to fiscal stability that states may face in years to come. Consolidated websites containing an array of disclosures are perhaps the most important way a state can offer a full range of data necessary to interpret budgets. Arkansas is the lone state lacking this vital communication platform. But while states averaged a B in transparency for fiscal 2015 through 2019, many still have room to improve the quantity and quality of budgetary information provided to the public. To measure states’ commitment to budgetary transparency, the Volcker Alliance sought answers to four questions.
Among transparency actions investigated were tax expenditures. While they are often used to attract new businesses or exempt items such as food or clothing from state levies, tax exemptions, abatements, or credits may deprive a state of revenues that may be needed currently or in the future. While states should comprehensively disclose the nature and value of tax expenditures in budget or related documents, eight fail to do so regularly.
Omitting deferred costs of maintaining infrastructure such as roads, bridges, and buildings is another significant shortcoming. While every state provides tables to show how much has been borrowed, often for infrastructure projects, only five provided data on accumulated deferred maintenance costs as of 2019: Alaska, California, Hawaii, Illinois, and Tennessee.
This table contains assessments of states’ actions to promote greater transparency of their budget and related information for fiscal 2015 through 2019. States are graded on a scale of A to D-minus, the lowest possible mark, on whether they had a consolidated website or set of related sites providing budget and supplemental data; provided tables listing outstanding debt, debt service costs, and information on any legal debt limits; disclosed the estimated cost of the deferred infrastructure maintenance liability for all capital assets as part of budget and planning documents; and provided an annual or biennial tax expenditure report in budget documents or through other agencies.
Transparency 5-Year Average Grades
State Grades Table
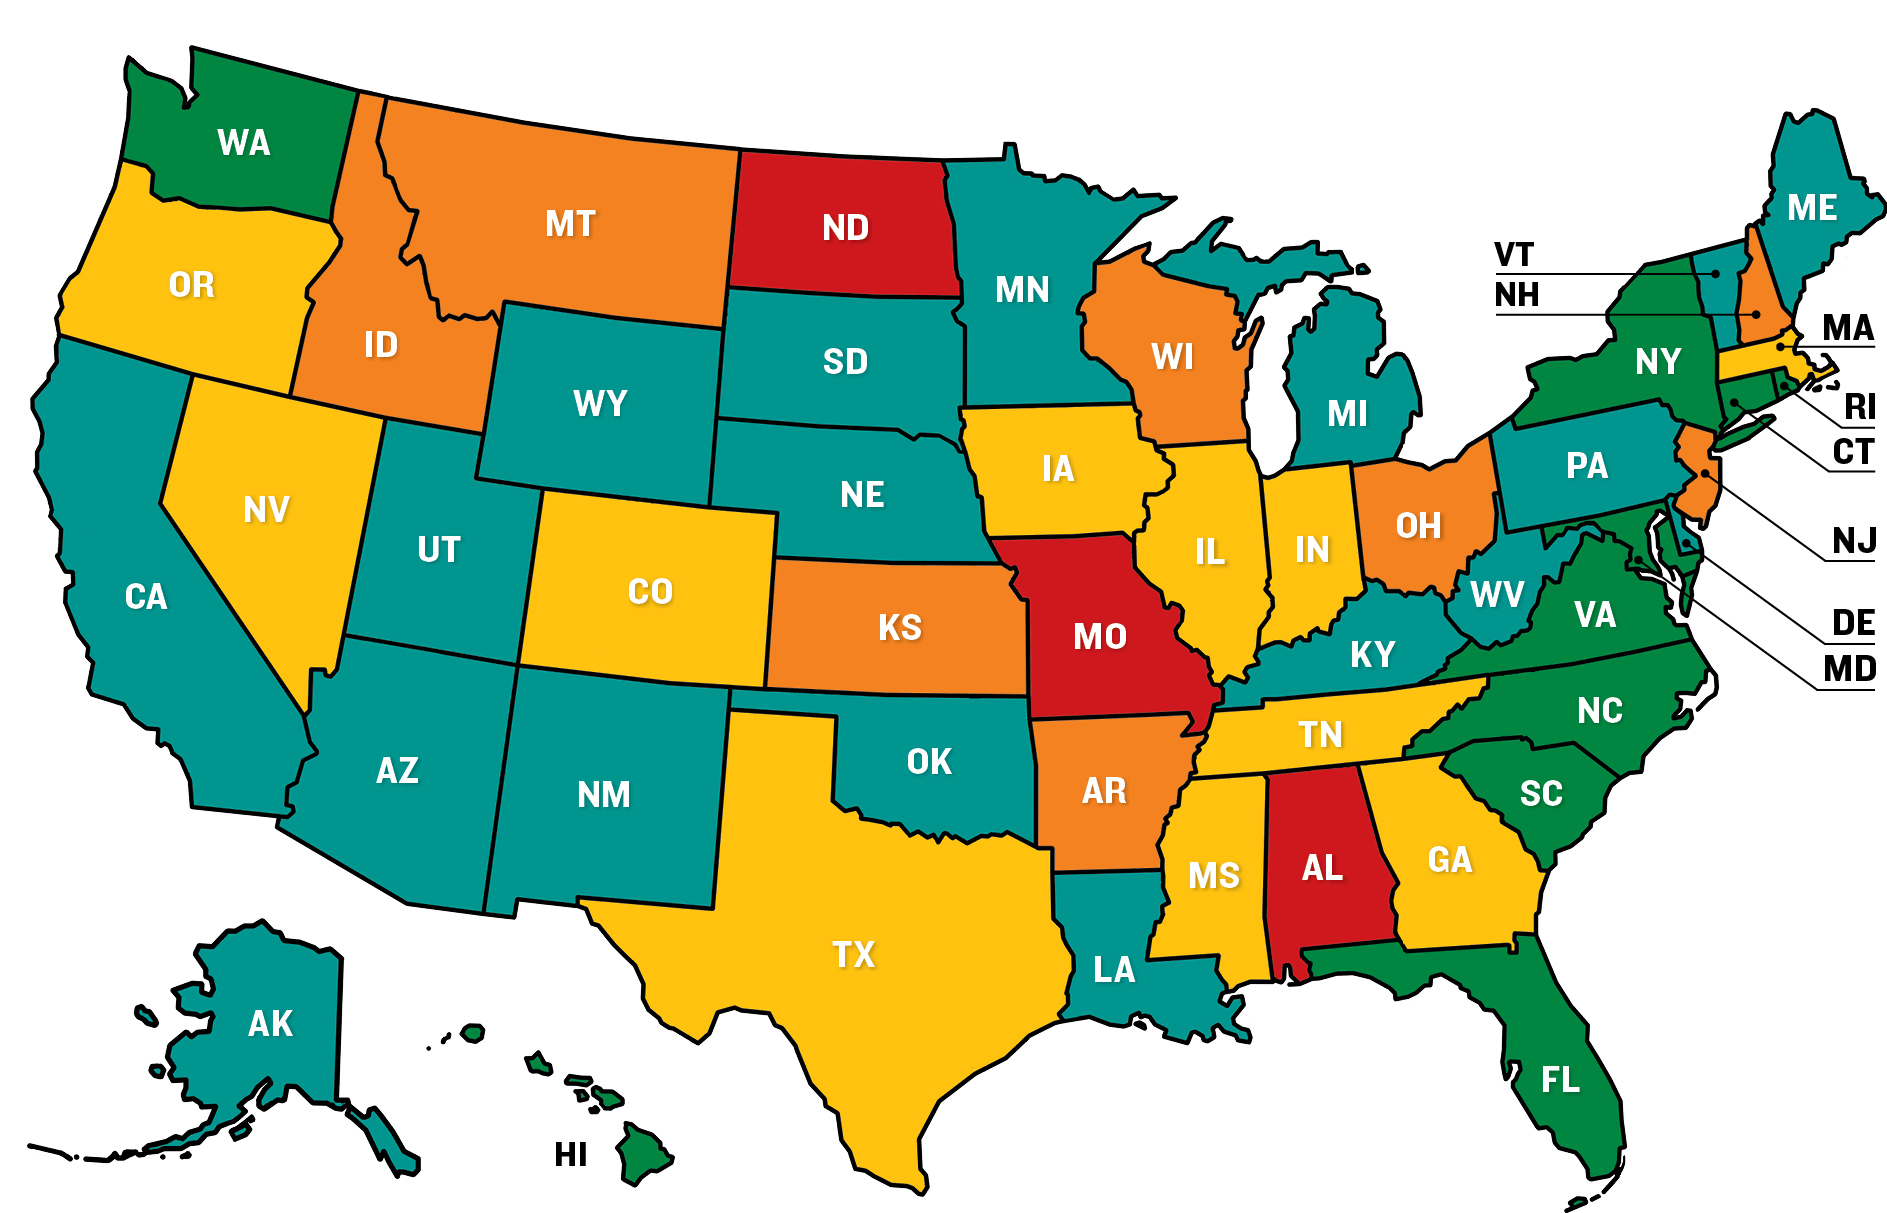
Fifty State Report Cards
The report cards, which can be accessed by clicking the map at the bottom of the page, contain each state’s average grades in all five budgetary categories for fiscal 2015 through 2019, along with their annual marks. The report cards also contain explanations of the principal drivers of each state’s grades, as well as comparisons with results in neighboring states.
Endnotes
1. The Volcker Alliance, Truth and Integrity in State Budgeting: What Is the Reality?, November 2017, 5, link.
2. Forty-six states begin their fiscal year July 1. The start dates of the four states that differ from the norm are Alabama, October 1; Michigan, October 1; New York, April 1; and Texas, September 1.
3. Barb Rosewitcz, Justin Theal, Joe Fleming, “States’ Financial Reserves Hit Record Highs,” Pew Charitable Trusts, March 18, 2020, link.
4. Shelby Kerns, “State Revenues Decline for First Time Since the Great Recession, with the Worst Still to Come,” National Association of State Budget Officers, September 8, 2020, link.
5. National Association of State Budget Officers, The Fiscal Survey of States, Fall 2020, viii, link.
6. The nine states whose S&P outlook deteriorated in the fourth quarter of fiscal 2020 were Connecticut, Hawaii, Illinois, Michigan, Nevada, New Hampshire, New Jersey, New Mexico, and Oklahoma. With the exception of Michigan, whose fiscal year ended Sept. 30, these states’ fiscal year ended June 30.
7. S&P Global Ratings, History of U.S. State Ratings, December 11, 2020, link.
8. Leslie Josephs, “US Airlines’ 2020 Losses Expected to Top $35 billion as Pandemic Threatens Another Difficult Year,” CNBC, January 1, 2021, link.
9. US Bureau of Economic Analysis, “Gross Domestic Product by State in Current Dollars [for Nevada and Hawaii],” October 2, 2020, link.
10. Email from Nicholas Johnson, executive director, Center on Budget and Policy Priorities, January 12, 2021.
11. Jared Walczak, “New Census Data Shows States Beat Revenue Expectations in FY2020,” Tax Foundation, September 2020, 3, link.
12. Tom Spencer, “Alabama Tax Revenues Remarkably Resilient in 2020,” Public Affairs Research Council of Alabama, October 15, 2020, link.
13. Erica Werner, Mike DeBonis and Paul Kane, “Senate Approves $2.2 Trillion Coronavirus Bill Aimed at Slowing Economic Free Fall,” Washington Post, March 25, 2020, link.
14. Jeff Stein and Mike DeBonis, “Senate Majority Leader Announces Approximately $900 Billion Deal on Emergency Relief Package,” December 20, 2020, link.
15. Keeley Webster, “California Year-to-Date Revenues Beat Forecast by $13.8 Billion,” Bond Buyer, December 18, 2020, link.
16. E.J. McMahon, “DiNapoli Predicts $3.8B More in State Tax Receipts,” Empire Center, November 6, 2020, link.
17. Volcker Alliance, Truth and Integrity in State Budgeting: The Balancing Act, 2020, v, link.
18. Jerry Zhirong Zhao, Camilla Fonseca-Sarmiento, and Jie Tan, America’s Trillion-Dollar Repair Bill, Capital Budgeting and the Disclosure of State Infrastructure Needs, Volcker Alliance, November 2019, 1, link.
19. Ron Snell, State Experiences with Annual and Biennial Budgeting, National Conference of State Legislatures, April 2011, 1, link.
20. State of Texas, General Appropriations Act for the 2018–19 Biennium, “Text of Conference Committee Report on Senate Bill No. 1,” Eighty-Fifth Texas Legislature, Regular Session 2017, May 25, 2017, X-3, link.
21. Pew Charitable Trusts, The State Pension Funding Gap: 2018, June 2020, 1, link.
22. Bloomberg pension data prepared for the Volcker Alliance, October 30, 2020.
23. Jessie Van Berkel, “Dayton Signs Pension Bill Aimed at Long-Term Stability in State Retirement System,” Star Tribune, June 1, 2018, link.
24. National Association of State Budget Officers, Fiscal Survey of States, 87, link.
25. North Carolina General Statutes § 143C-4-2(b) (b1), link.
The research for this report was conducted by professors and graduate students at The City University of New York; Florida International University; Georgia State University; University of California, Berkeley; University of Kentucky; the Chicago and Springfield campuses of University of Illinois; and University of Utah. The schools’ efforts were augmented by Volcker Alliance staff, data consultants at the research firm Municipal Market Analytics, and special project consultants Katherine Barrett and Richard Greene. The Volcker Alliance is thankful to all of the research partners who helped make this report possible.
State Budget Grades and Sources
- National Organizations and Federal Agencies
- Alabama
- Alaska
- Arizona
- Arkansas
- California
- Colorado
- Connecticut
- Delaware
- Florida
- Georgia
- Hawaii
- Idaho
- Illinois
- Indiana
- Iowa
- Kansas
- Kentucky
- Louisiana
- Maine
- Maryland
- Massachusetts
- Michigan
- Minnesota
- Mississippi
- Missouri
- Montana
- Nebraska
- Nevada
- New Hampshire
- New Jersey
- New Mexico
- New York
- North Carolina
- North Dakota
- Ohio
- Oklahoma
- Oregon
- Pennsylvania
- Rhode Island
- South Carolina
- South Dakota
- Tennessee
- Texas
- Utah
- Vermont
- Virginia
- Washington
- West Virginia
- Wisconsin
- Wyoming

