Truth and Integrity in State Budgeting - The Balancing Act

Dedication
Paul A. Volcker (1927-2019)
 In his introduction to the 2017 report Truth and Integrity in State Budgeting: What Is the Reality?, Paul A. Volcker, the Volcker Alliance’s founding chairman, wrote that the mission of the Alliance “is to improve the effectiveness of the administration of government at all levels, and making processes such as state budgeting more transparent is important to that goal.”
A better-informed public “should provide decision makers with incentives for transparency and accuracy in setting out spending and revenue reporting.” he wrote. The Alliance, he continued, “hopes that drawing attention to prevailing practices—and identifying the strongest and weakest among them—will encourage new efforts to raise standards for all states.”
In his work as Federal Reserve Board chairman, as well as his subsequent pursuits, Mr. Volcker, who died in December 2019 at the age of 92, was always a steadfast advocate for making government live up to a high standard. At the Alliance, he frequently pored over drafts of the Truth and Integrity in Government Finance Initiative’s reports and working papers, asking pointed questions and offering suggestions based on his decades of public service to help make the work more actionable. His long-standing goal of producing “a scorecard of good fiscal practices,” as he once put it, is reflected in this fourth edition of Truth and Integrity in State Budgeting, which contains comprehensive state budget grades, expanded report cards, and a compendium of best practices in all fifty US states.
Mr. Volcker was especially concerned, as he wrote in 2015, that many states were under fiscal pressures that led them to “shift current costs onto future generations and push off the need to make hard choices on spending priorities and revenue practices.” That unfortunate reality—which remains as true today as it did five years ago—was also a focus of his work before the Volcker Alliance’s founding, as cochairman of the State Budget Crisis Task Force along with Richard A. Ravitch, his longtime colleague and an Alliance director. Paul Volcker had keen insights into the execution of government at all levels. This report is another contribution to his legacy of making government more effective and building a more stable future for us all.
-William Glasgall
Preface
This report marks the Volcker Alliance’s third annual assessment of the budget practices of the fifty US states. Covering fiscal 2017, 2018, and 2019, the study grades states’ success in pursuing transparent and fiscally sustainable procedures as they attempt to keep revenues and expenditures in balance from the beginning to the end of each year.
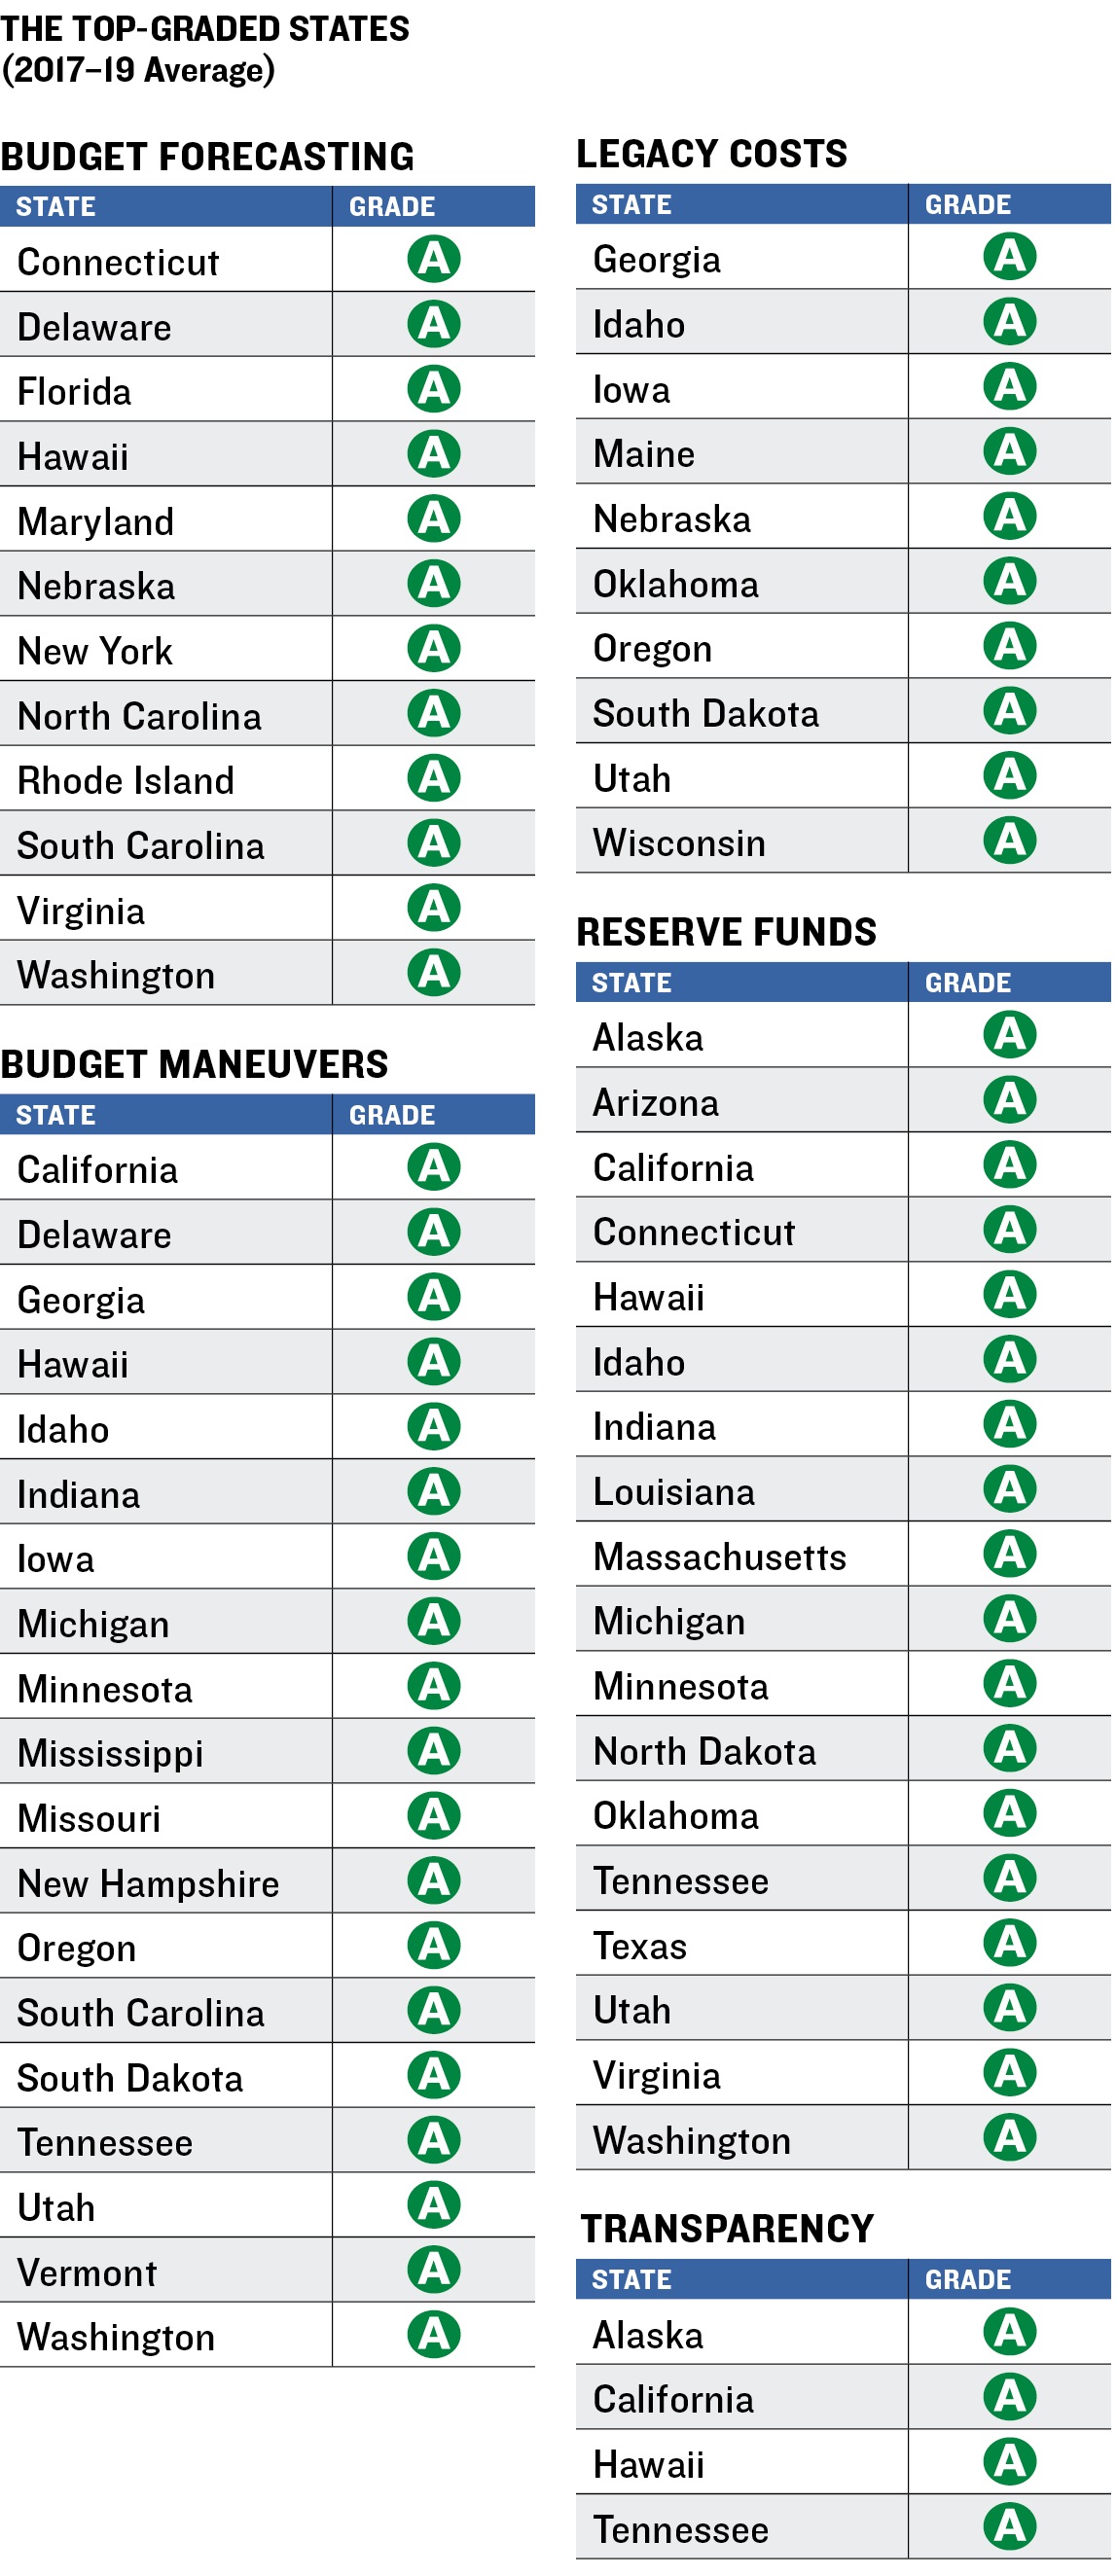
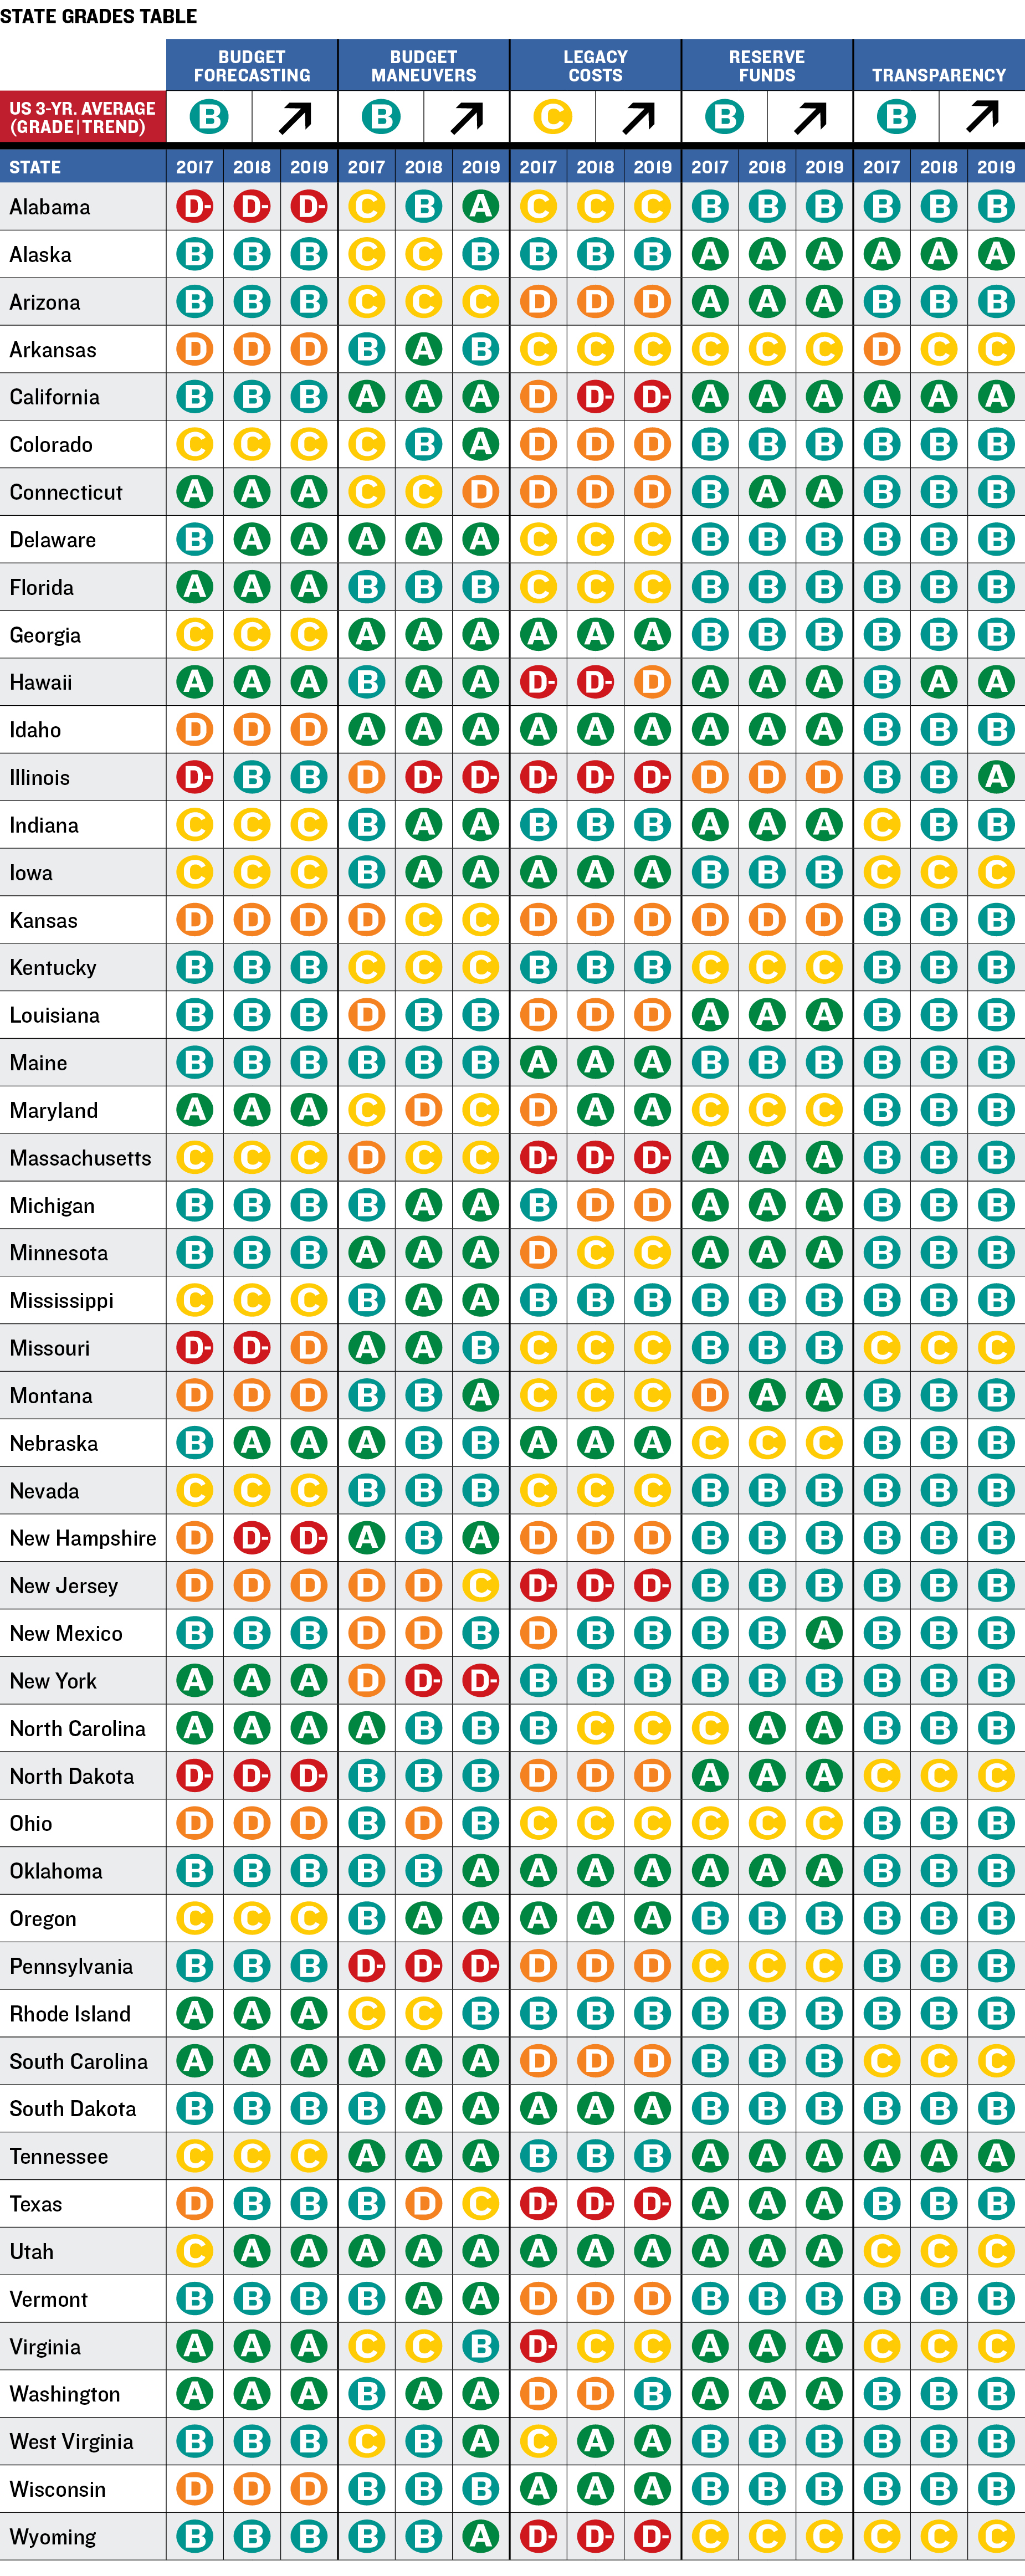
As in our 2017 and 2018 reports, we give states grades of A to D-minus, the lowest possible mark, for their practices in five building blocks of budgeting:
- Budget forecasting, in which we evaluate how and whether states estimate revenues and expenditures for the coming fiscal year and the long term;
- Budget maneuvers, in which we gauge dependence on one-time actions to offset recurring expenditures;
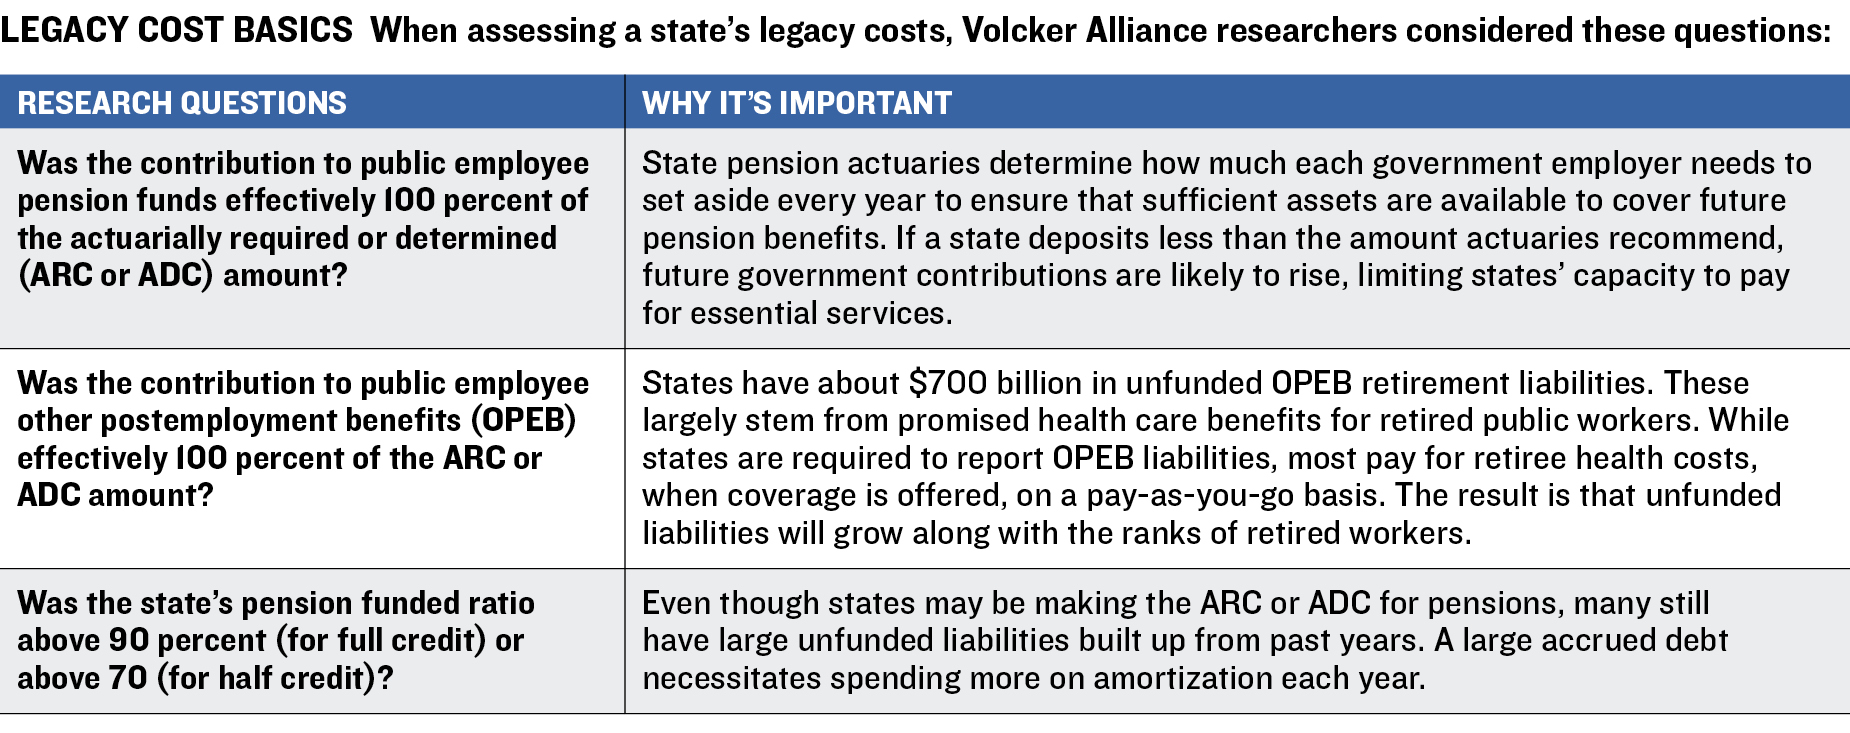
- Legacy costs, in which we assess how well states are funding promises made to public employees to cover retirement costs, including pensions and retiree health care;
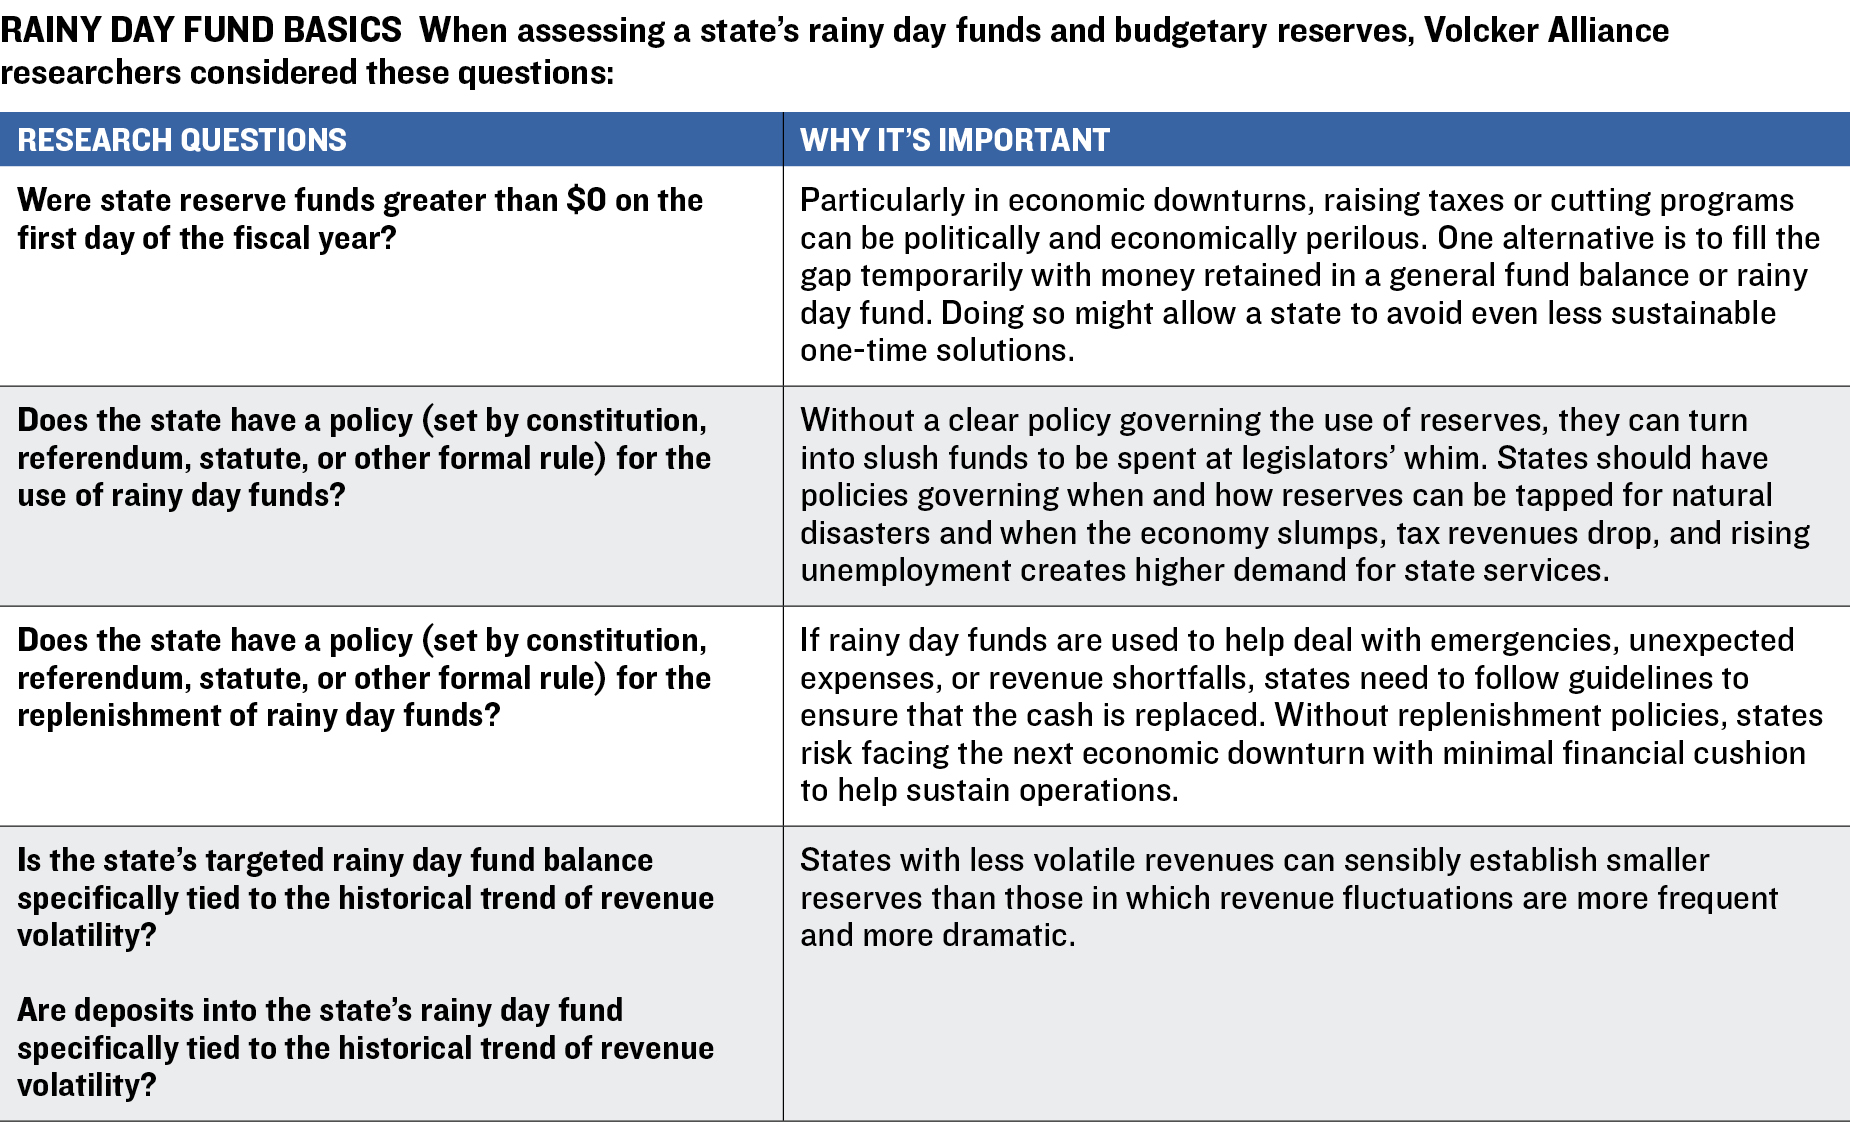
- Reserve funds, in which we examine the condition of general fund reserves as well as rainy day funds and rules governing their use and replenishment; and
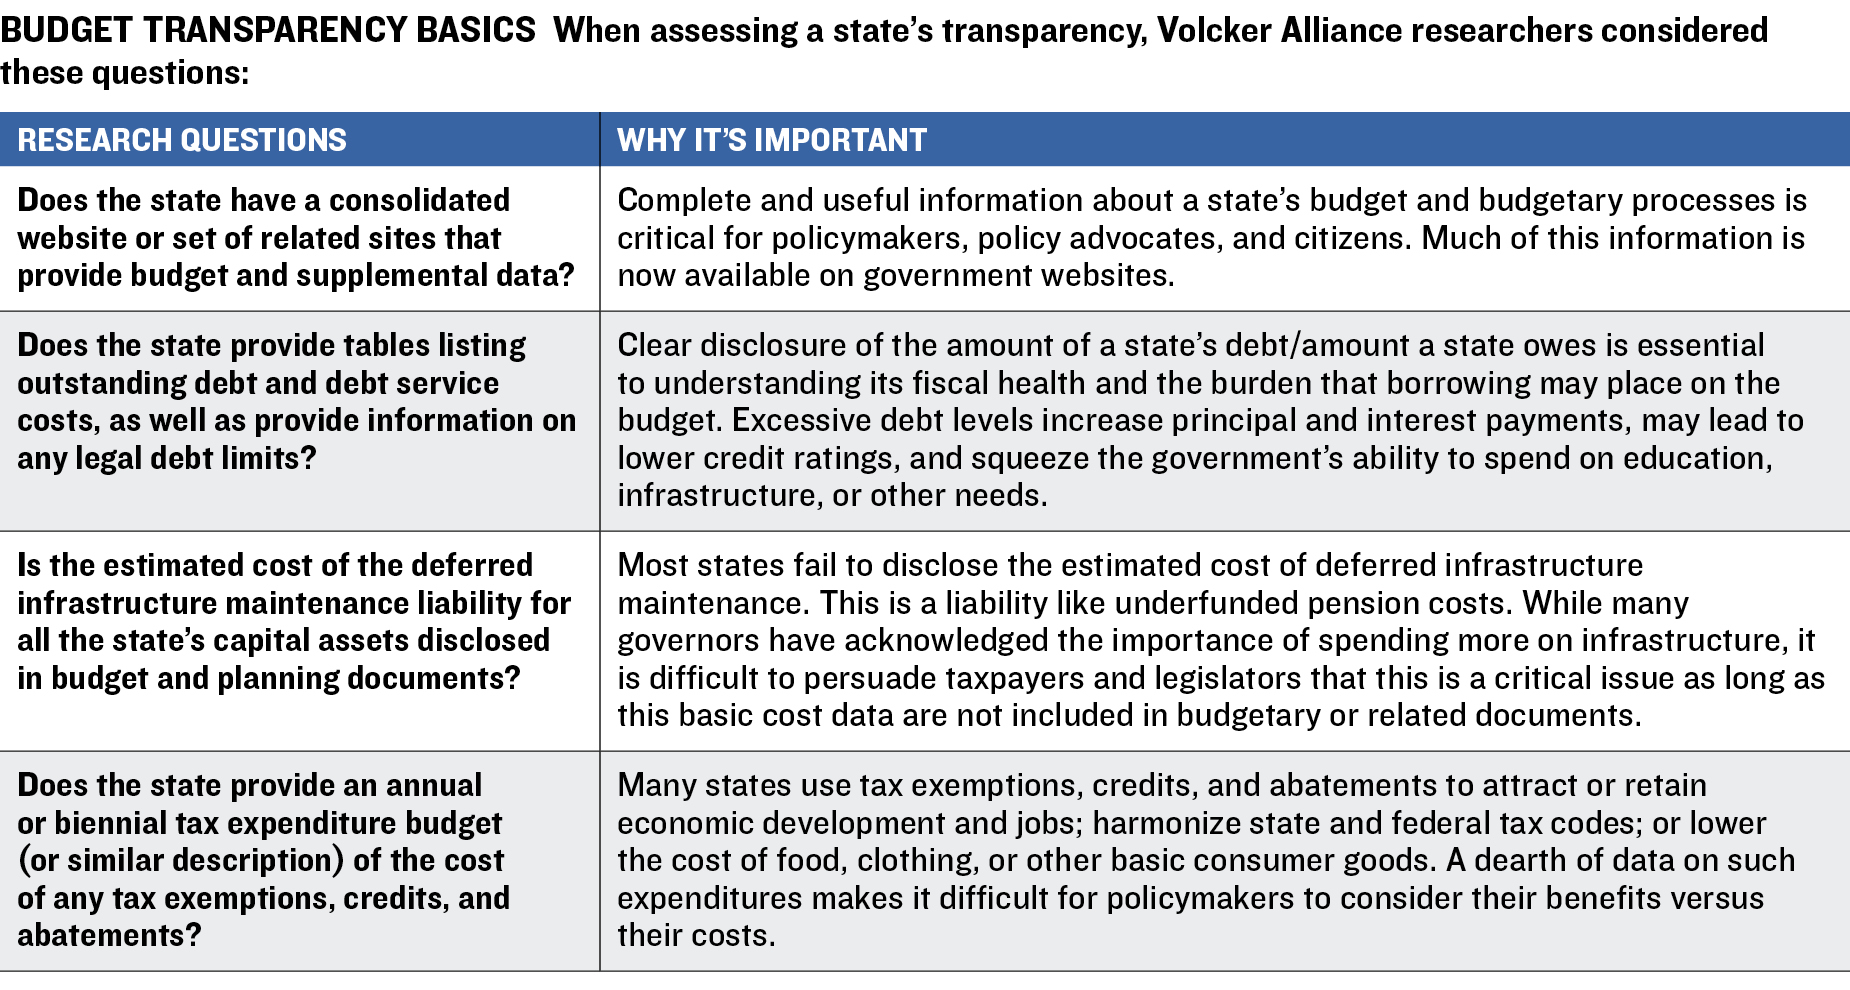
- Budget transparency, in which we scrutinize disclosure of budget information, including debts, tax expenditures, and the estimated cost of deferred infrastructure maintenance.
In this report, we also compare states’ budgetary grades to marks given the year before and provide individual assessments of each state across the five budget categories.
Introduction
Across America, states have benefited mightily from the longest economic recovery since the mid-nineteenth century.1 Total state expenditures reached $2.1 trillion in fiscal 2019, equivalent to about 10 percent of US gross domestic product, and states’ spending of their own funds, excluding federal transfers, was the highest since the Great Recession.2 The recovery is reflected in a widespread improvement in our third annual evaluation of the budgetary practices of all fifty states. But the advances are tempered by deeply rooted fiscal challenges in many states that will make it harder to balance budgets if the rebound—now over a decade old—slows or reverses course.
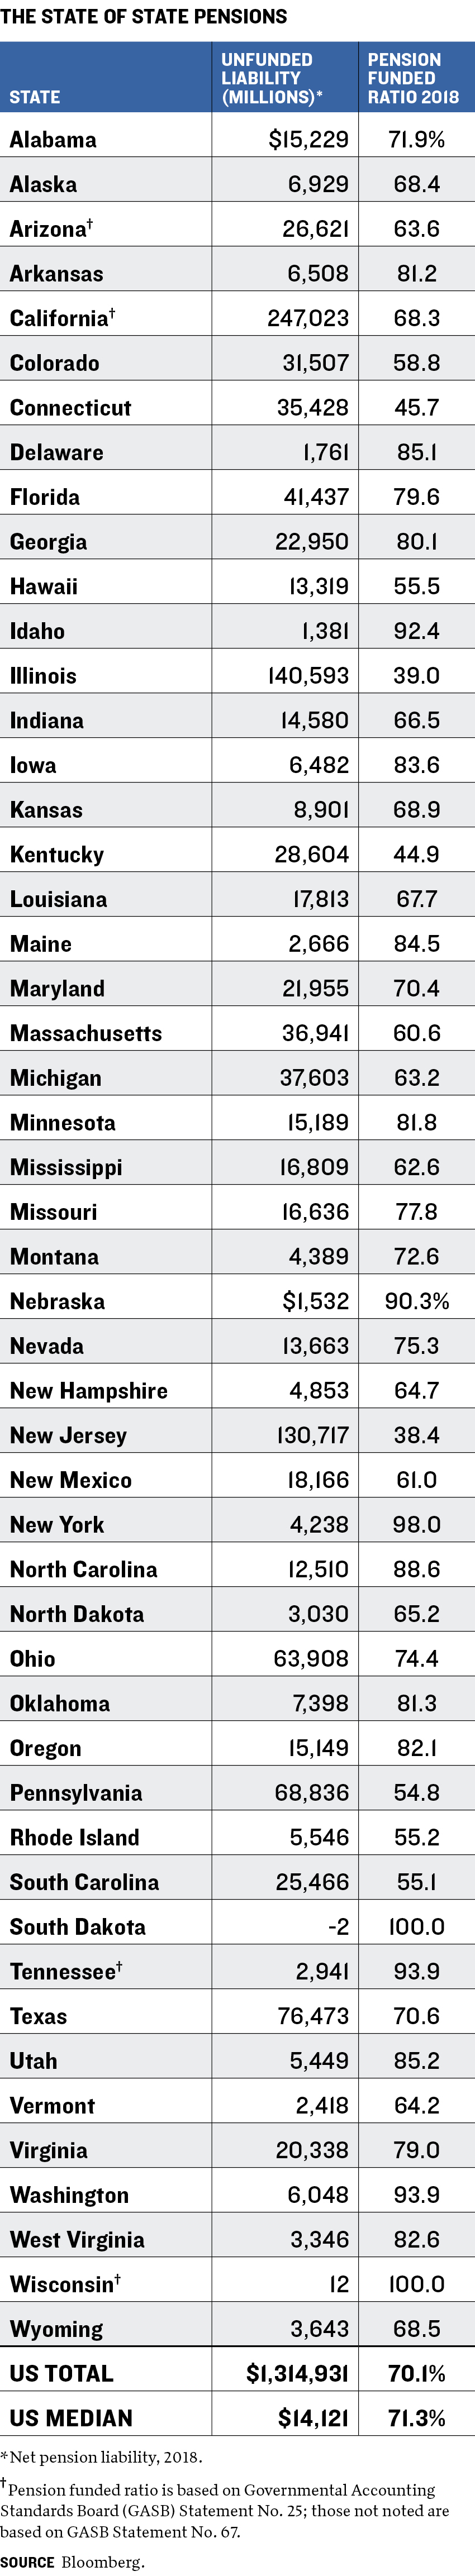
For example, public employee pensions remain a concern from coast to coast. Despite steady GDP growth and stock market gains, states have been able to salt away only 70.1 percent of the assets they need to cover their $4.4 trillion in pension liabilities, according to data compiled by Bloomberg for the Volcker Alliance. They also confront a shortfall of almost $1 trillion in deferred maintenance costs for roads, bridges, and other public infrastructure,3 and they need to come up with trillions more to fund promises for retiree health care, elementary and higher education, and other essential services. Yet even in the face of these shortfalls, states continue to declare their annual or biennial budgets balanced—forty-nine of them do so by law and one, Vermont, by practice. Because of the cash-based accounting method widely used in state budgeting, governments can leave these unfunded liabilities for future generations.
This edition of Truth and Integrity in State Budgeting covers fiscal 2017 through 2019 and evaluates how—and how transparently—each state assembles and balances its budget. The data and conclusions in this report are the product of research by public finance specialists and graduate students at eight universities, augmented by input from state budget and financial officials, finance experts at the consulting firm Municipal Market Analytics, and Volcker Alliance staff members. This report also draws on two state-focused working papers published in 2019 by the Alliance: America’s Trillion-Dollar Repair Bill: Capital Budgeting and the Disclosure of State Infrastructure Needs and Rainy Day Fund Strategies: A Call to Action. For the first time, we have included a set of detailed state report cards that previously were published separately. Along with other resources available on the Alliance’s website, they form a state budget laboratory that can point policymakers, advocates, investors, and citizens toward best practices for crafting fiscally sustainable strategies.
Conclusions
As in previous editions of Truth and Integrity, we have graded states in five fundamental categories that are critical to their ability to maintain budgetary balance for the long term and for each year evaluated. States are graded on a scale of A to D-minus. (The Alliance does not issue an F mark; even the most fiscally challenged states have some budget practices worth emulating.) The areas of evaluation and principles underlying our assessments include:
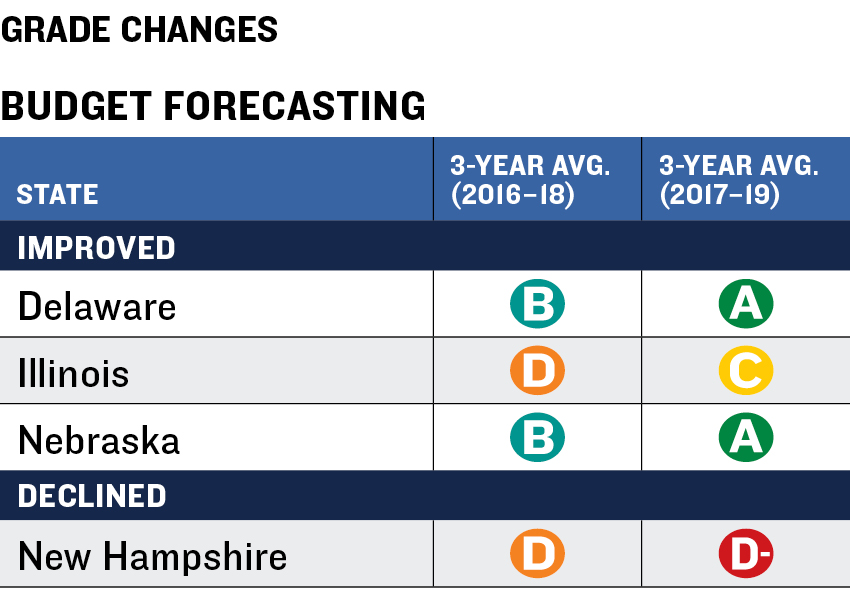
Budget forecasting. States should adopt binding consensus estimates for revenues and make predictions about both revenues and expenditures for more than the next fiscal year. A one-year estimate does little to reveal structural deficits that may dog subsequent budgets. States averaged a B for fiscal 2017 through 2019. Compared with our 2016–18 evaluation, marks improved for three states and declined for one.
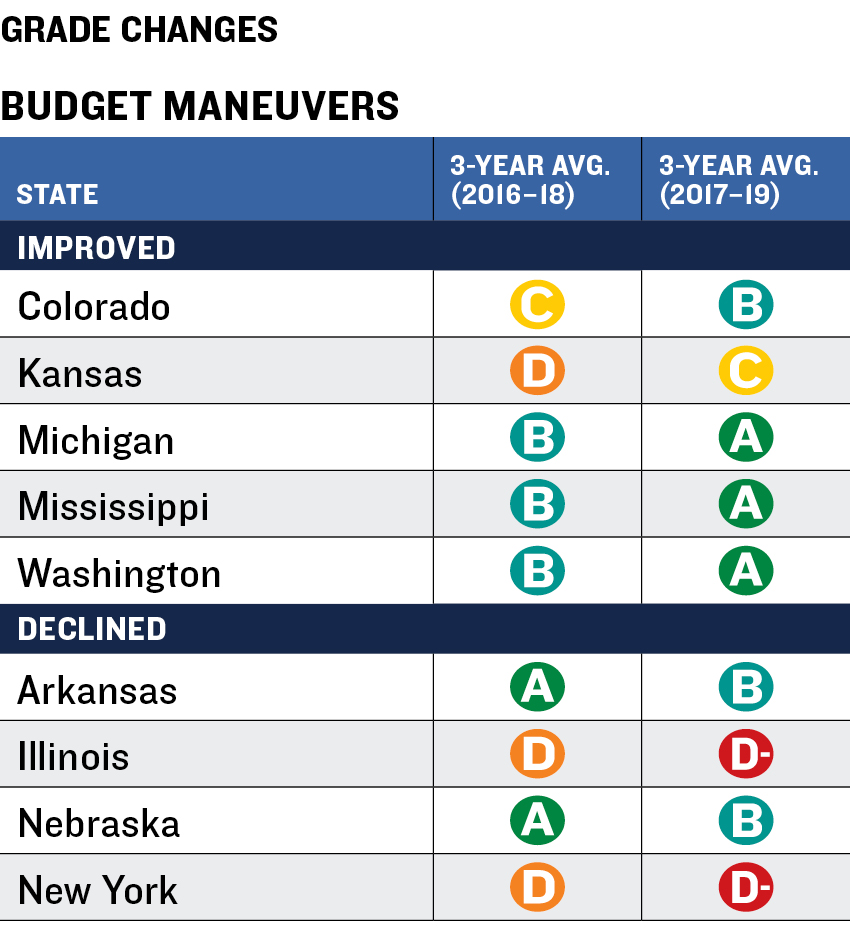
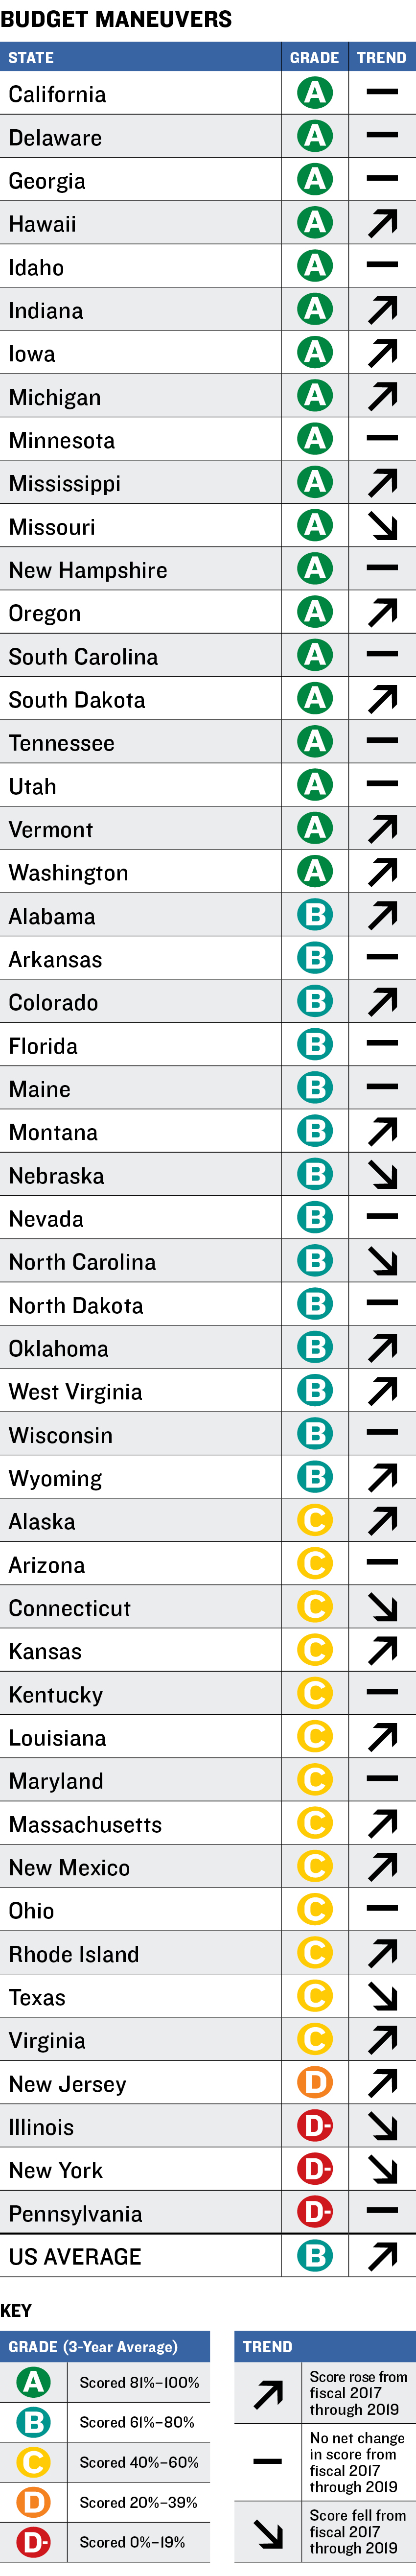
Budget maneuvers. To avoid creating long-term structural deficits that burden future budgets, states should pay for expenditures with recurring revenue earned the same year. The 2017–19 average in the category was B, with grades rising from the previous evaluation for five states and falling for four.
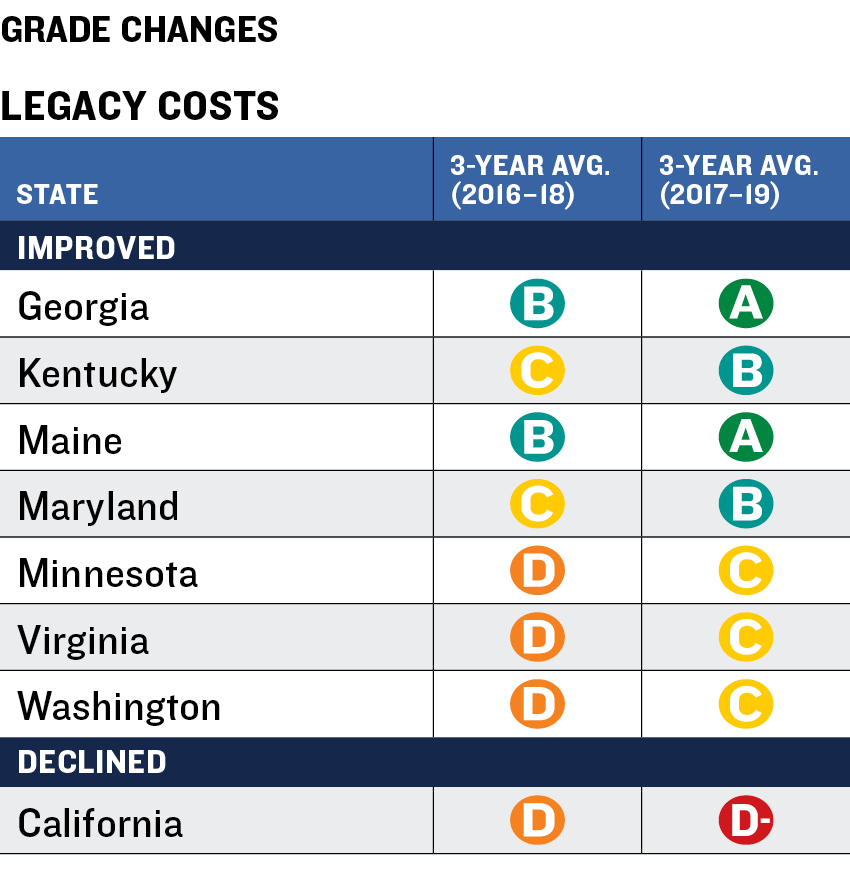
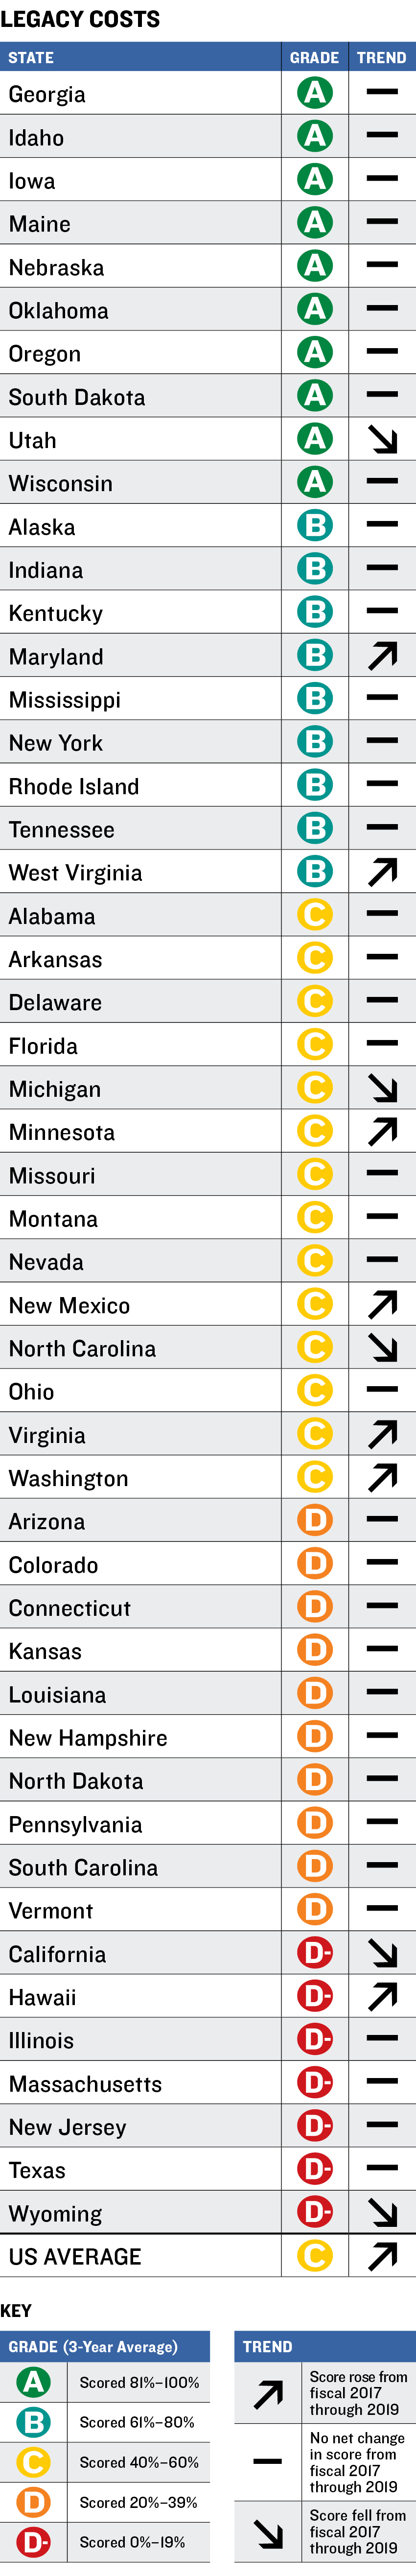
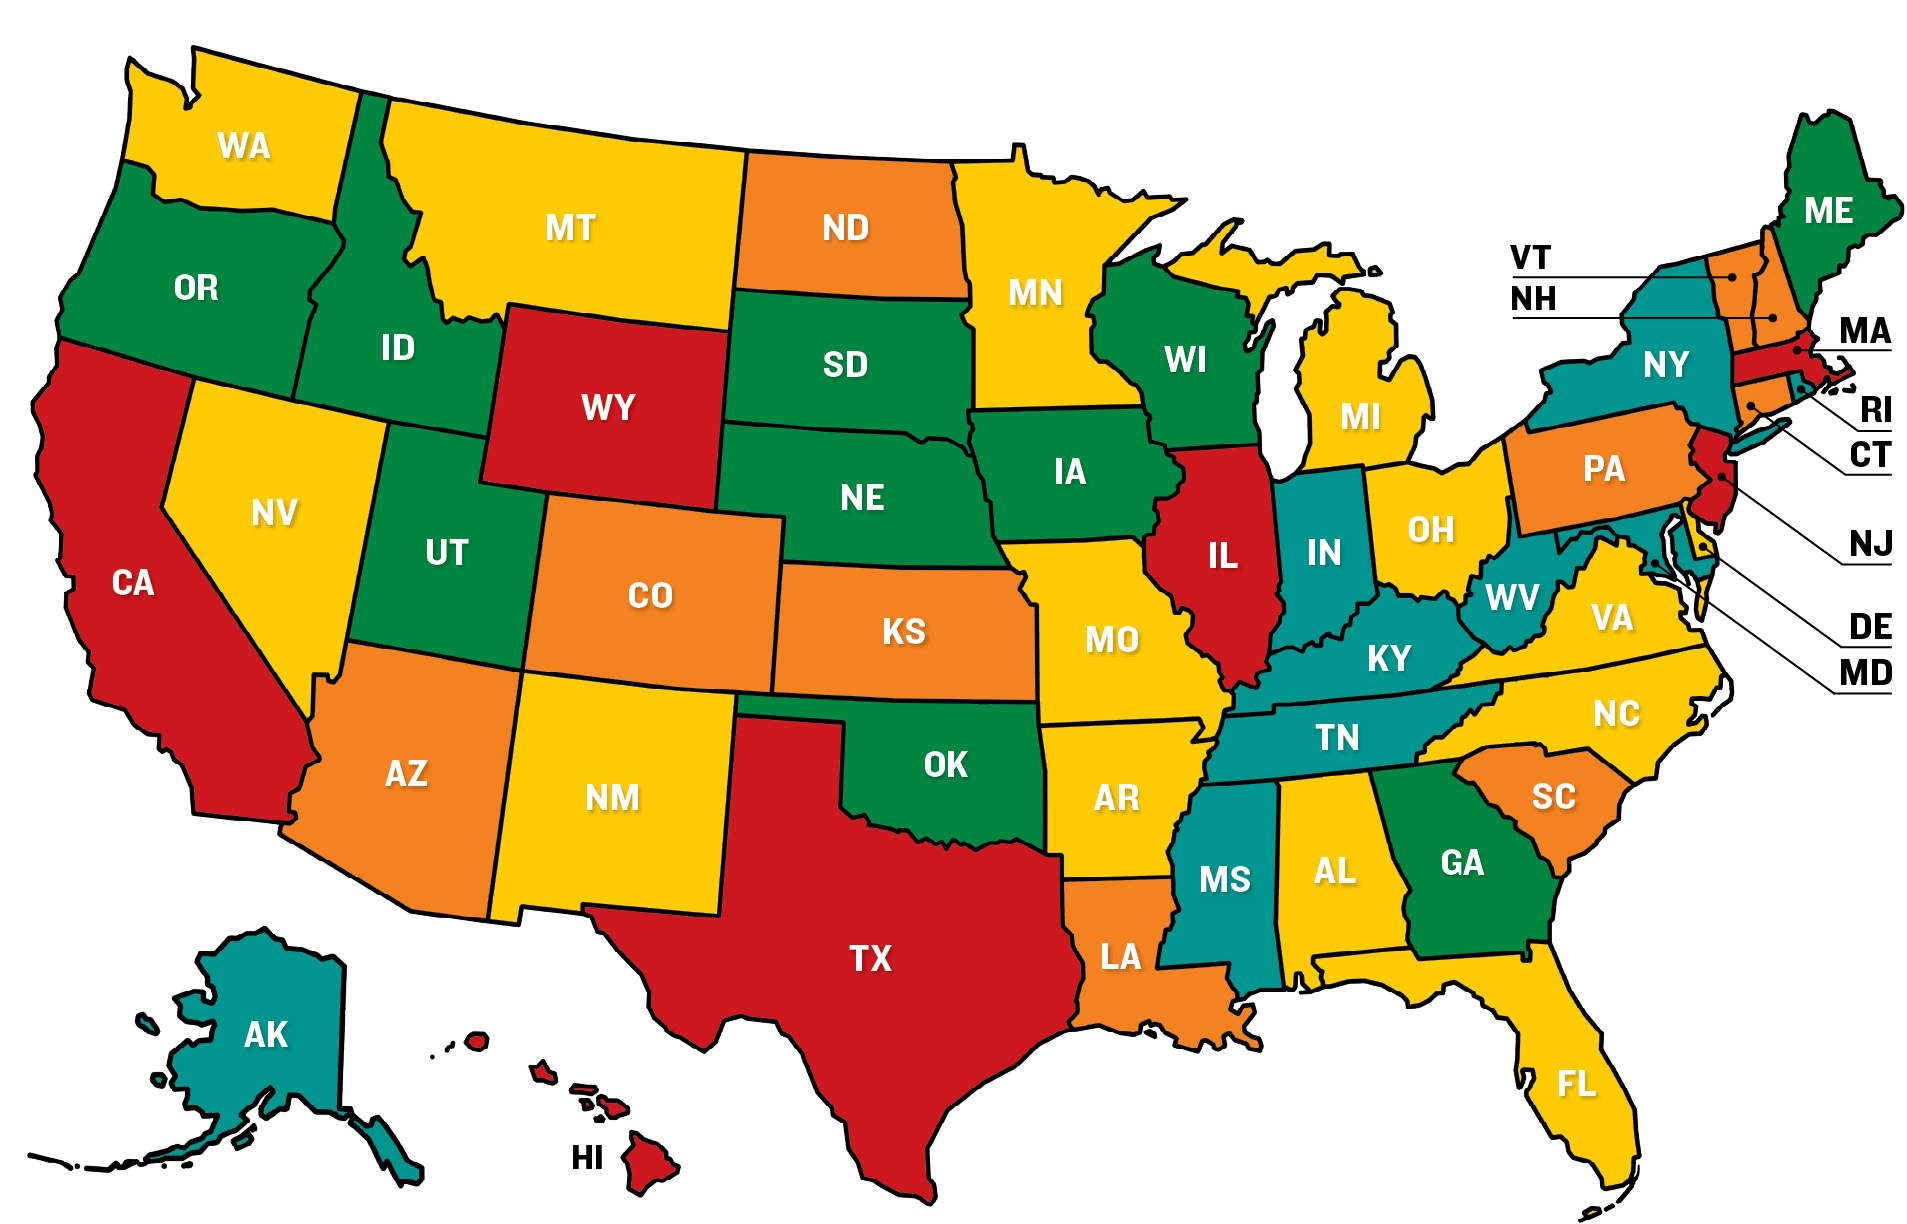
Legacy costs. States should consistently make contributions that actuaries deem sufficient for pension and retiree health care plans. This principle is quantitatively the most important area of this study but presents a conundrum for states with severely underfunded pension systems. They need to simultaneously maintain essential public services and cover workers’ retirement needs while repaying debts from years in which actuarially recommended pension contributions were not made. This was the lowest-graded category on average, with an overall grade of C for the three years covered. Still, financial market gains and higher revenue helped seven states raise their 2017–19 average from the previous evaluation; only one saw a drop.
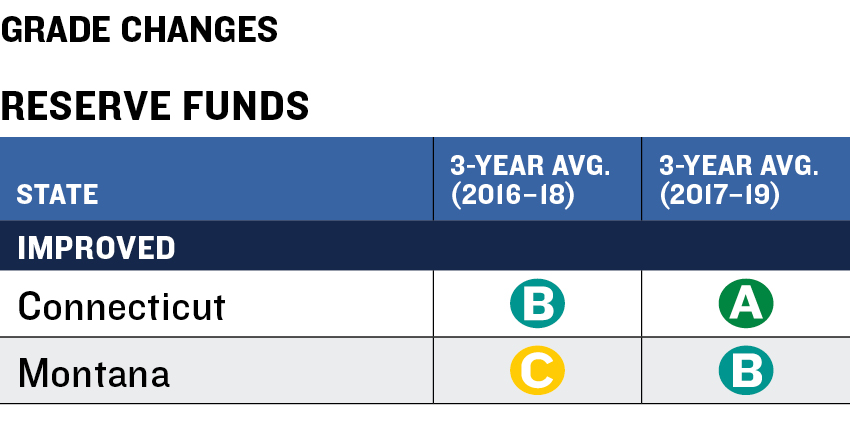
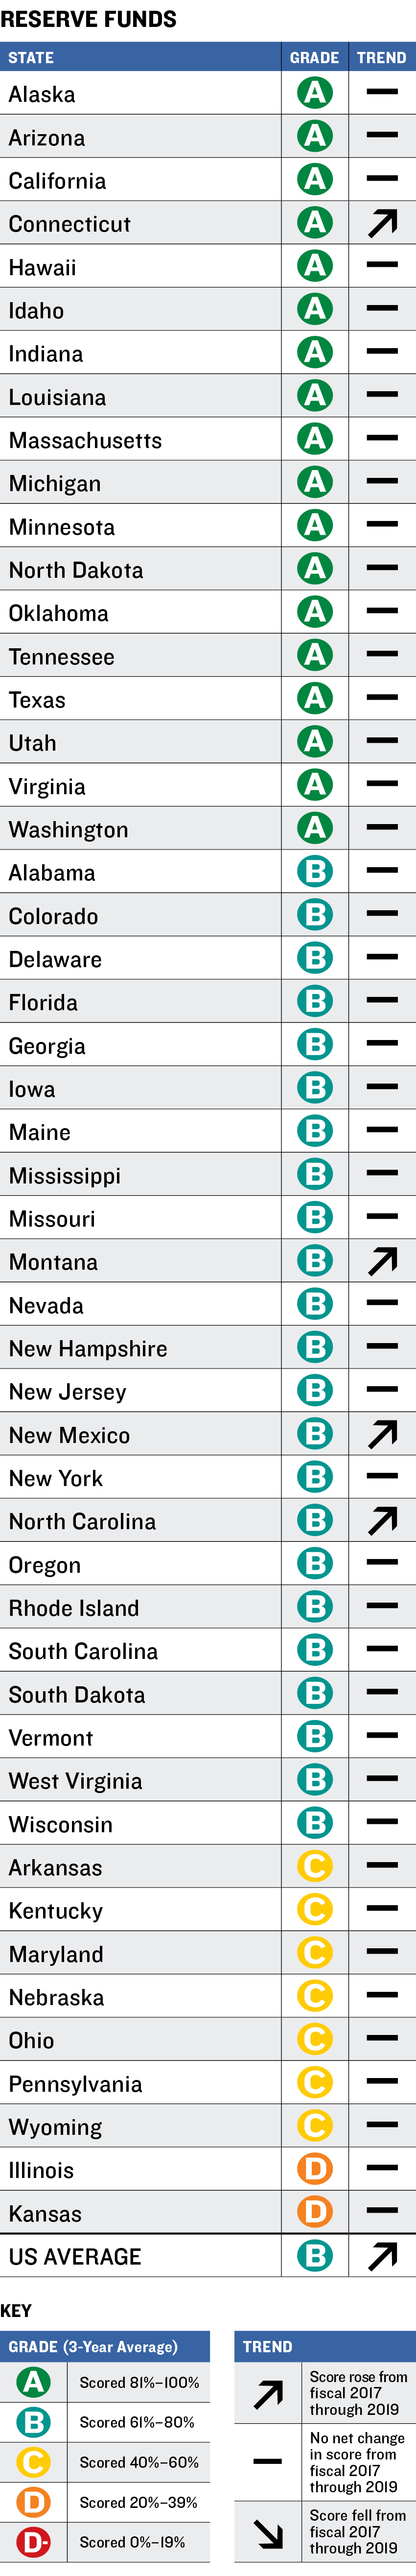
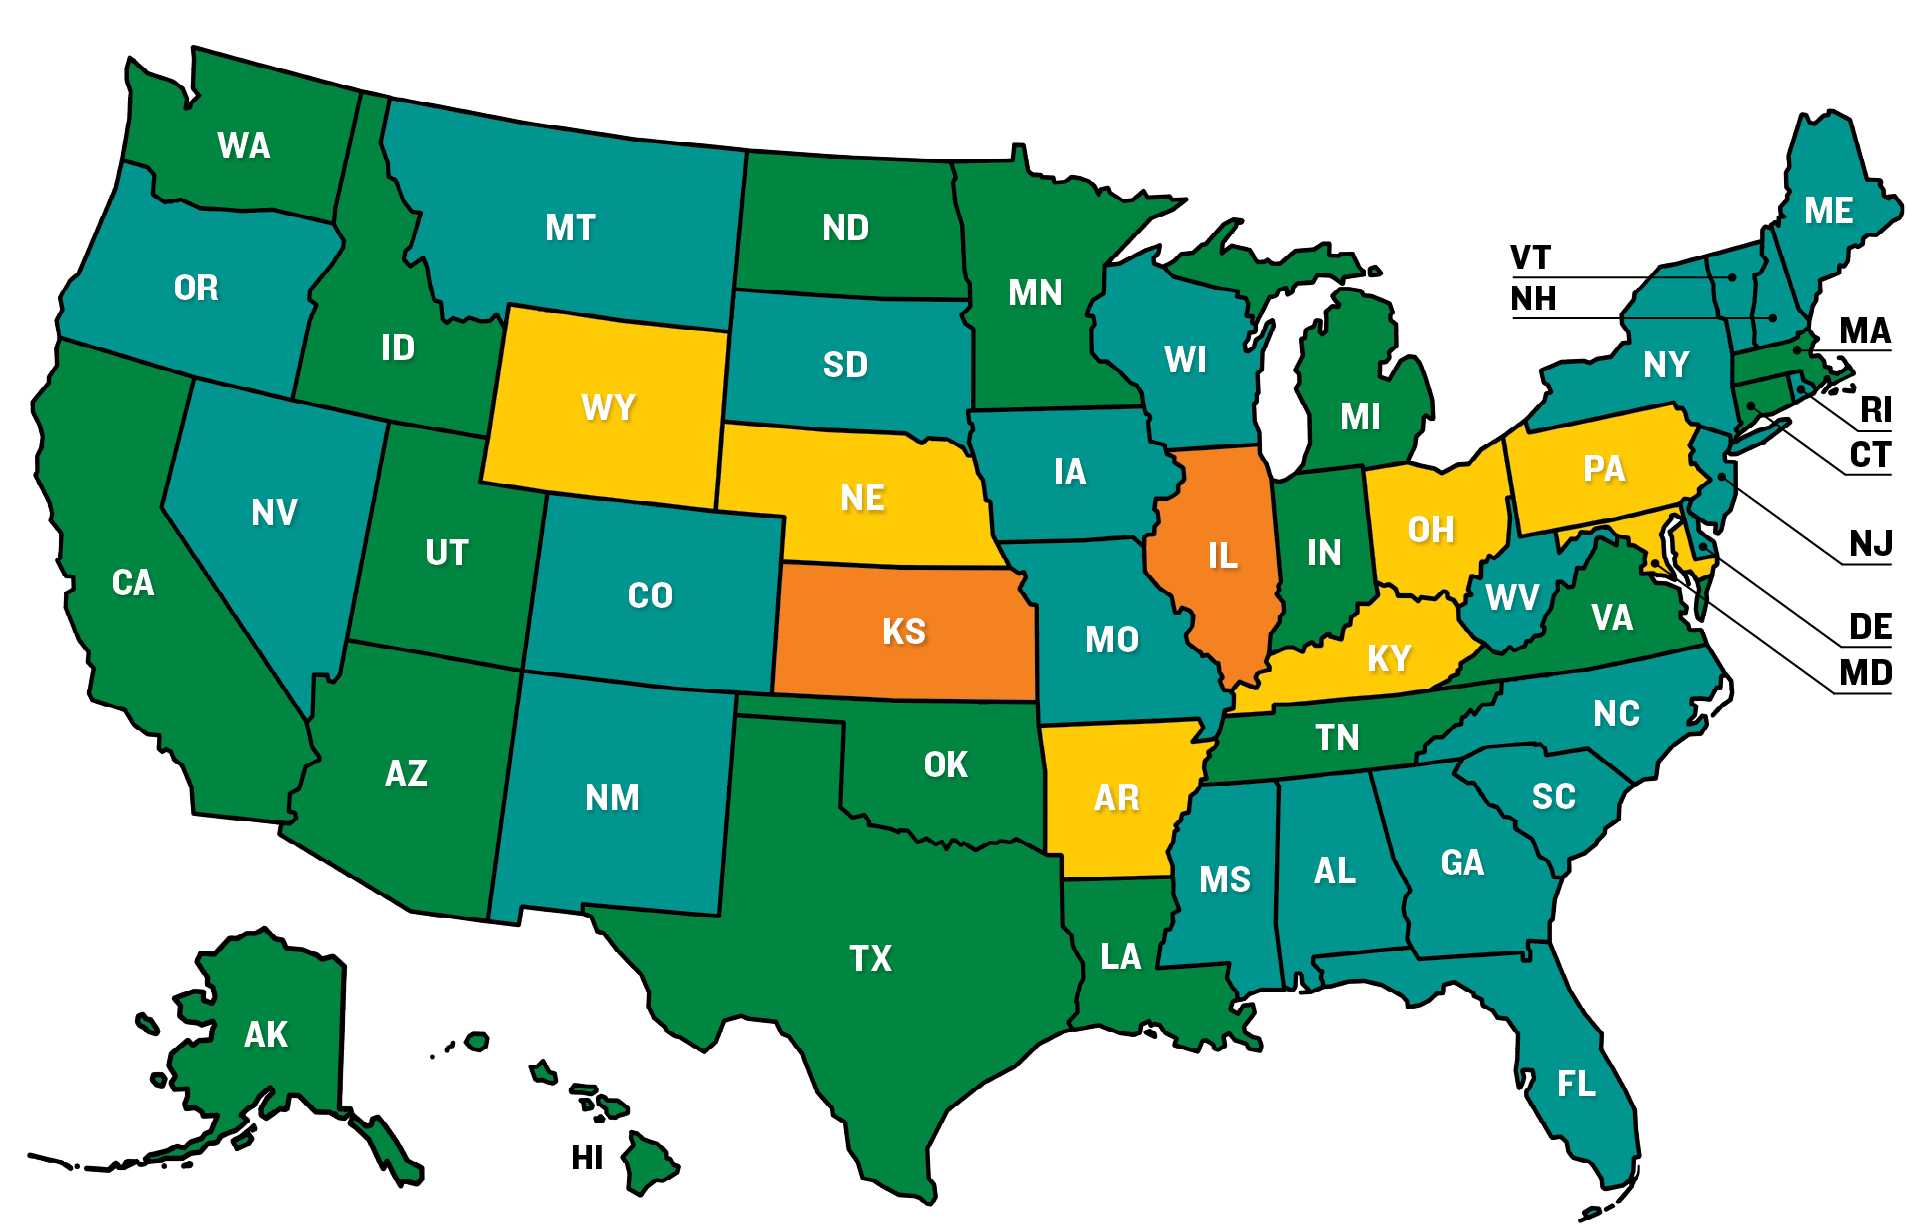
Reserve funds. States should enact clear policies for rainy day fund deposits and withdrawals and adjust fund levels for the historical volatility of their revenues. The category average was B for 2017–19, with the marks of two states rising from the previous evaluation, and none declining.
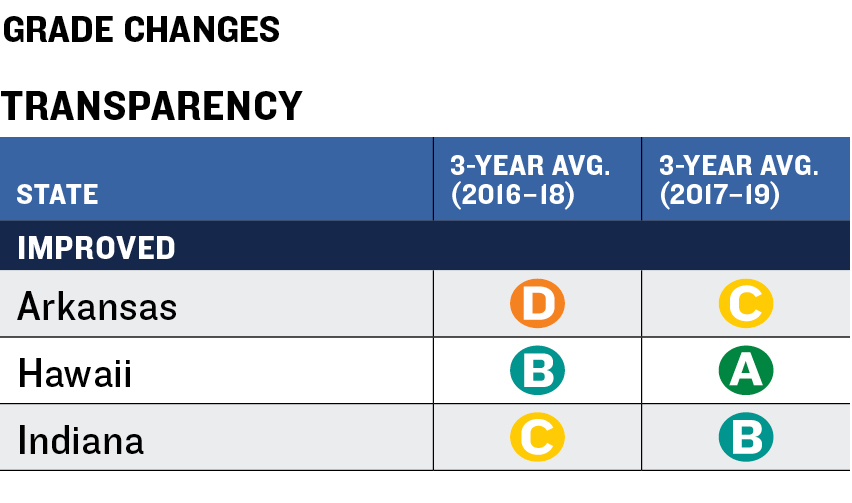
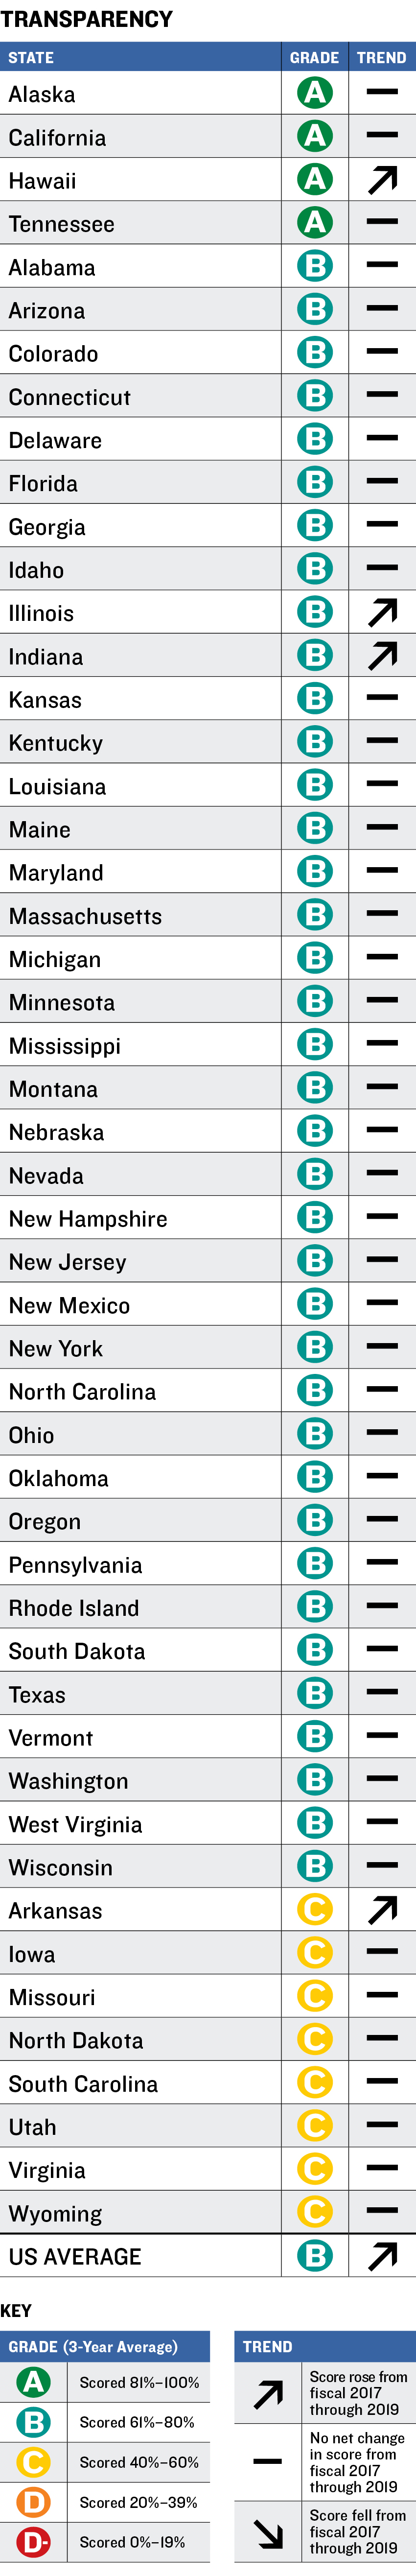
Transparency. States should provide the data that public officials and citizens need to understand budgets. This includes online disclosure of budgetary information; public reporting of the scope and cost of tax expenditures, such as exemptions, credits, and abatements; and reporting of the cost of deferred infrastructure maintenance. States averaged a B in the period, with three states earning higher marks than in the previous evaluation and all others stable.
As difficult as it can be for states to follow the principles and best practices described in this report, the task of balancing budgets could be easier if they all adopted the modified accrual form of budgetary accounting instead of the cash-based method in general use. Cash accounting recognizes budgetary expenditures only when bills are paid.4 This allows governments to commit to spending but to declare budgets balanced by deferring cash outflows until checks are cut. The modified accrual accounting method is more conservative. Used for budgeting by some municipalities, including New York City after its near-bankruptcy in 1975,5 the technique requires recognition of promised payments when liabilities are incurred. The method is already recommended by the Governmental Accounting Standards Board for municipal financial statements, including comprehensive annual financial reports. Adoption of modified accrual for budgets would eliminate many one-time maneuvers and lead to genuinely balanced budgets.
Areas of Analysis
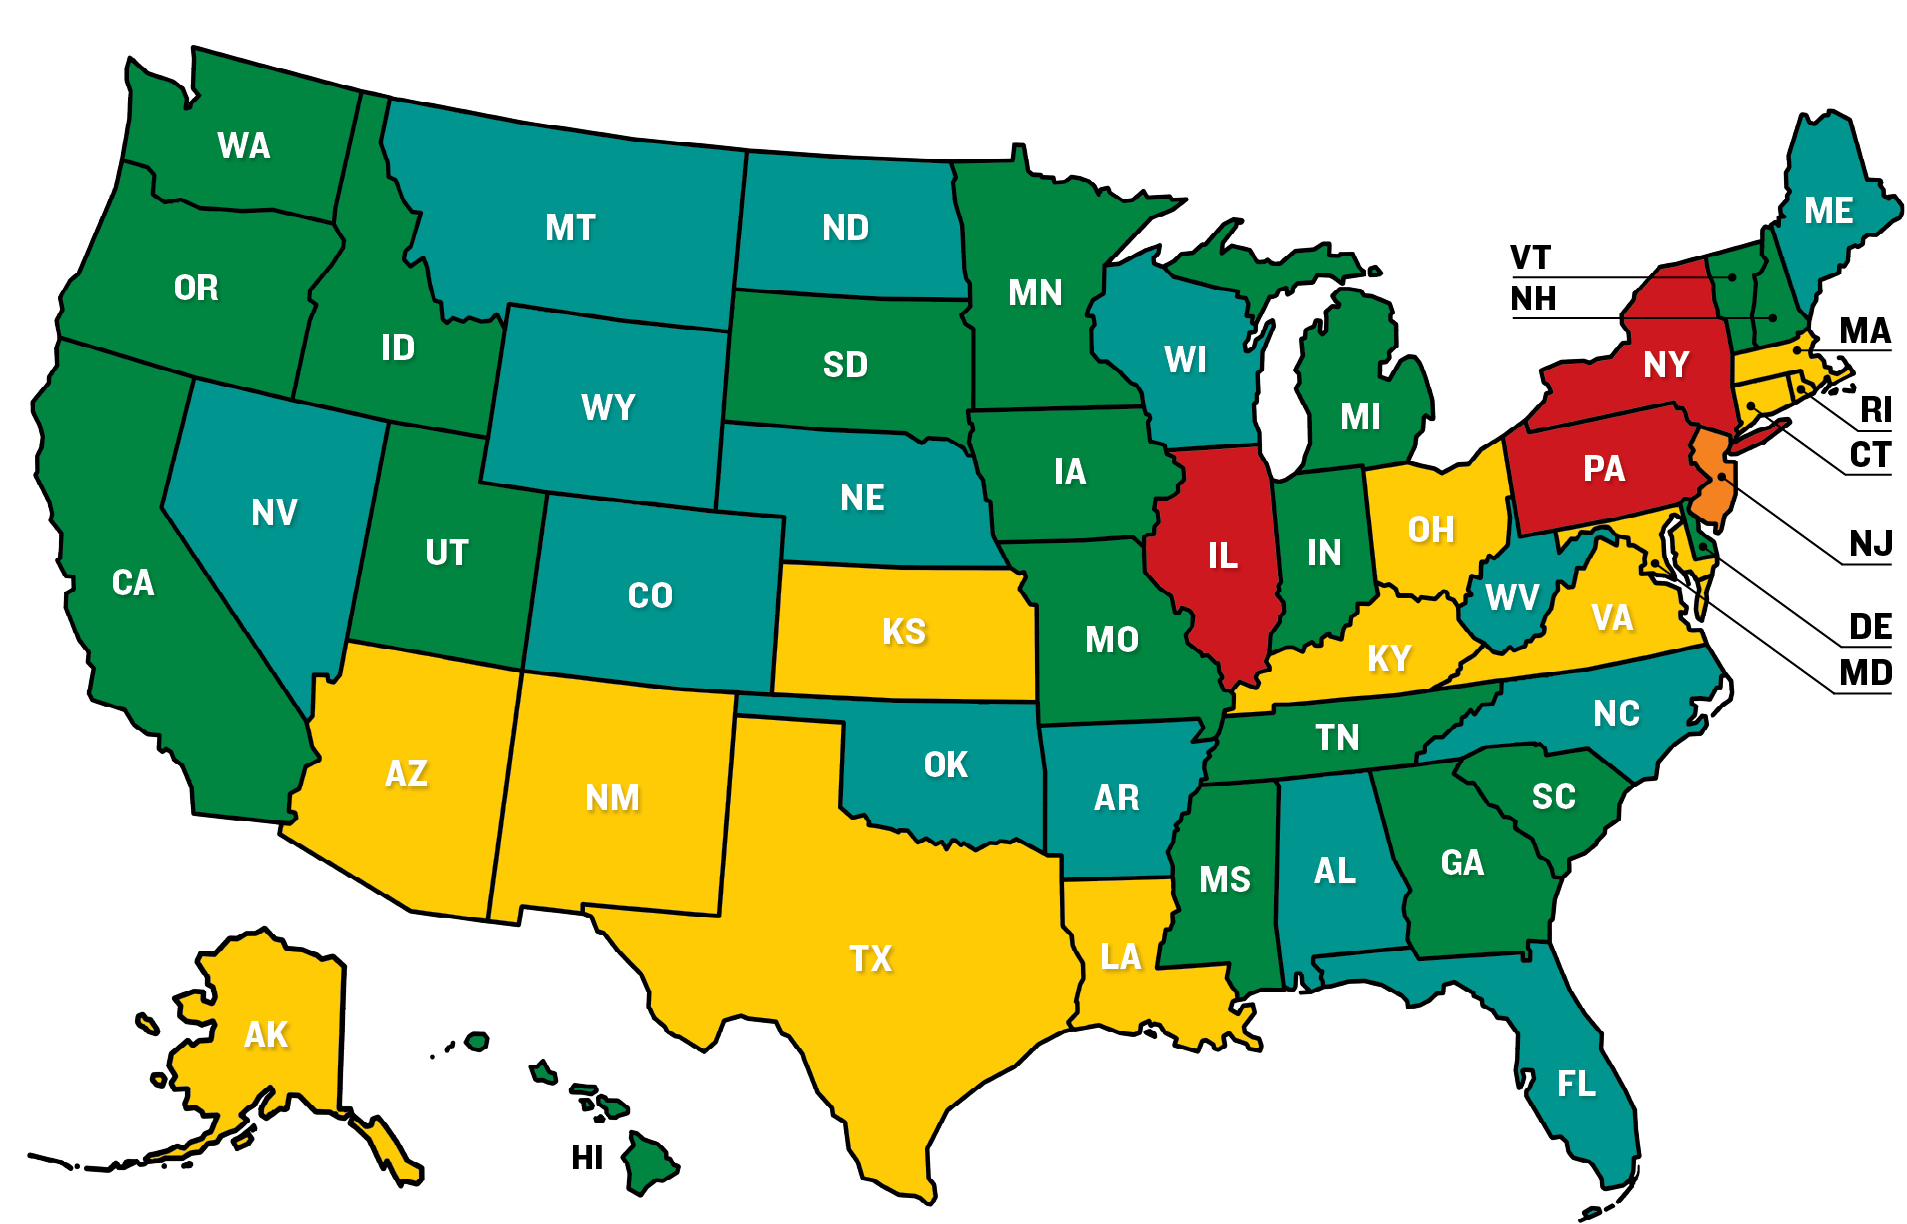
The grades assigned to states in each budgetary category highlight common themes and regional differences. Eastern states, including those in the New England and South Atlantic regions, generally did better in budget forecasting than those in the West. By contrast, the weakest grades in budget maneuvers were all east of the Mississippi River.
The impact of a strong economy is evident in the individual tales of a number of states, particularly in grades for budget maneuvers and reserve funds. Many states began fiscal 2019 with surpluses, which were largely generated by growth in personal income tax revenues.6 This helped them avoid borrowing or selling assets to cover budget shortfalls and reduced the need to tap one-time revenues or push recurring expenditures into future years to achieve balance.
Prolonged GDP growth also helped states build up reserves. Twenty-five states have policies governing the use of surpluses to fill rainy day funds,7 and the National Association of State Budget Officers estimates that the $72.3 billion in emergency reserves were at a record high as of fiscal 2019—7.6 percent of general fund spending.8 However, even record rainy day balances cannot outweigh the trillions of dollars in unfunded pension and other postemployment benefit (OPEB) liabilities, which may take decades to overcome.
Following is a discussion of the results in each of the five evaluated budget categories.
Budget Forecasting
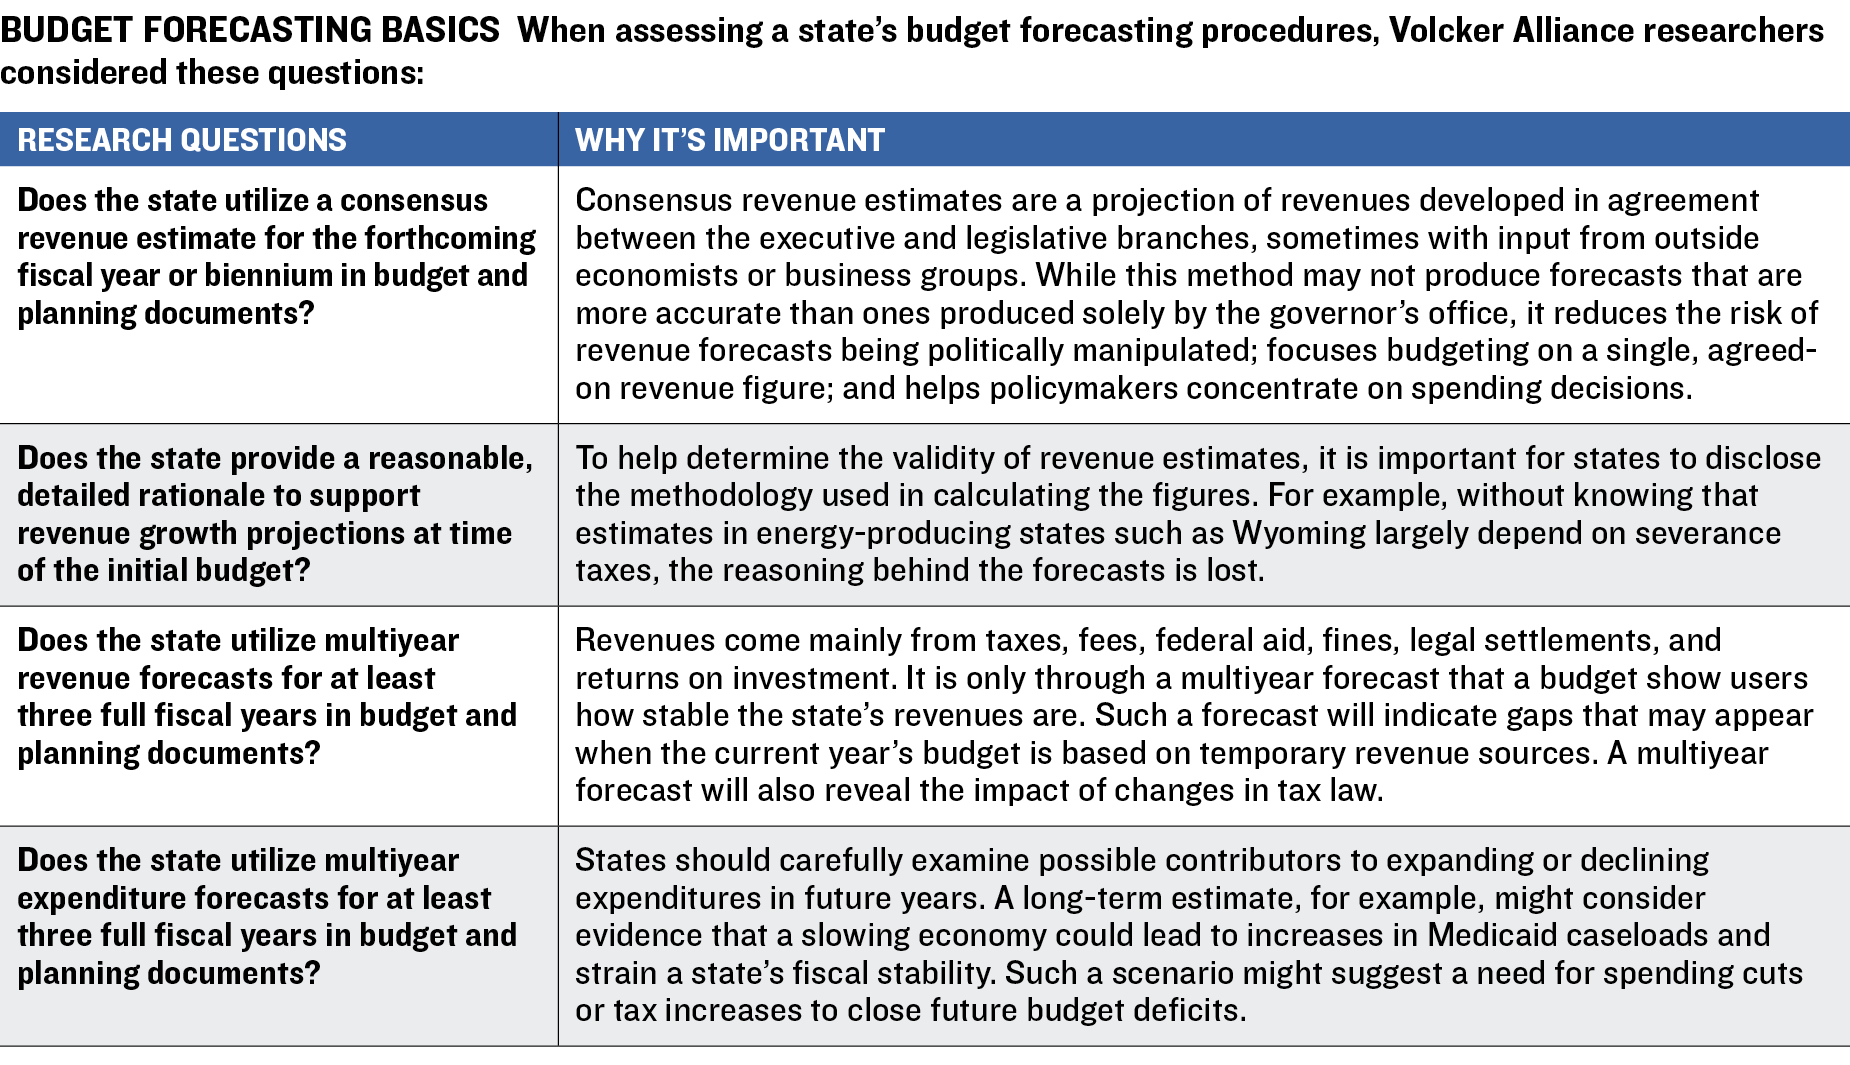
We relied on four major indicators to evaluate budget forecasting: the use of consensus revenue estimates, multiyear revenue forecasts, and multiyear expenditure forecasts; and the inclusion of a detailed rationale for revenue growth projections at the time of the original budget.
All but eight states provided explanations for expected revenue growth. A standout was Maryland, which received an A average for budget forecasting for 2017–19. The state also provided information about assumptions that go into all of its forecasts in material from the Board of Revenue Estimates, which includes the state comptroller, treasurer, and secretary of budget and management. In periodic updates, the board explains its use of indicators for state and federal economic conditions such as wages and salary, personal income, total nonagricultural employment, and private housing starts.9
In our latest assessment we found twenty-nine states using consensus revenue forecasts arrived at by the legislative and executive branches. A consensus approach ensures that all budgeters base their work on the same projection. While it does not necessarily generate the most accurate forecasts, it can create a more efficient budgeting process that eliminates political squabbles over the amount of money available to support state expenditures.10 In many states, the consensus revenue estimate binds the budget, with the governor and legislature restricted from spending more than the consensus revenue figure.11
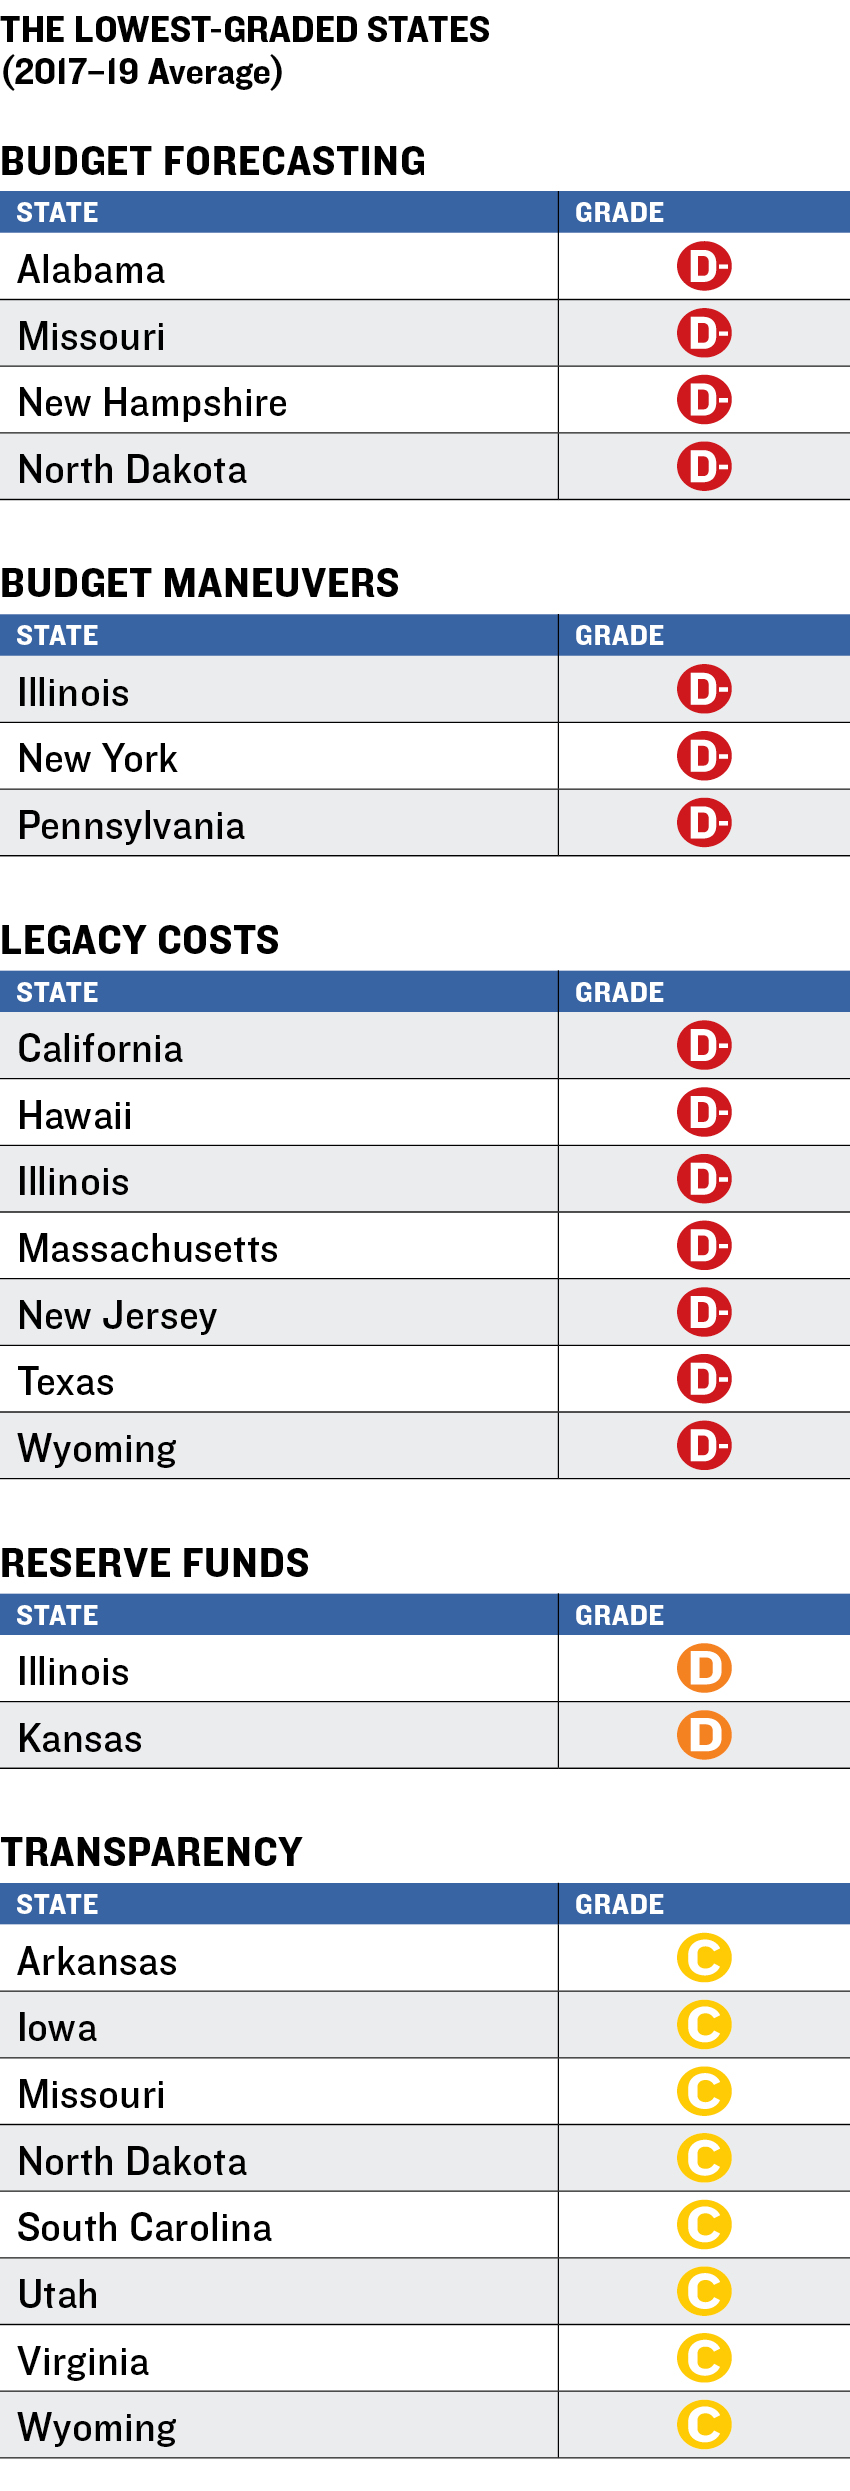
States including Florida, New York, North Carolina, and Washington rely on such consensus procedures for their projections. In Florida, for example, experts including staffers at the legislature’s Office of Economic and Demographic Research help the governor, Senate, and House of Representatives arrive at a single, universally accepted projection.12 Florida’s consensus system contrasts with the approach taken by states such as Alabama and North Dakota. Alabama leaves revenue forecasts entirely in the hands of the executive branch.13 Meanwhile, North Dakota uses estimates generated by the executive’s Office of Management and Budget. A committee that includes at least two legislators reviews the revenue forecasts, but its role is strictly advisory.14
Consensus forecasts usually focus on the upcoming annual or biennial budget. A longer outlook is needed to help ensure the sustainability of future budgets. That is why we give credit in the budget forecasting category to states using revenue and spending projections that extend at least three years beyond the current fiscal year. Fortunately, most states take this approach. As of fiscal 2019, thirty-two disclosed revenue projections at least three fiscal years out, while twenty-six estimated expenditures for at least the same period. Long-term budget projections can help insulate states against the impact of predictable demographic changes, such as the costs of predictable school enrollment. They can also be useful for estimating the impact of tax cuts or increases. And they can help prevent decision-making that concentrates on the short term and may involve pushing recurring expenditures into the future or expanding programs that cannot be sustained.
In North Carolina, the biennial budget that covered July 2017 through June 2019 included revenue and expenditure projections through 2022. North Carolina statutes also require a five-year forecast of expenditures to accompany proposals for new laws or any new or expanded programs. In this way, the state can track proposed changes that will affect budgetary balance.15
Texas has changed its estimating practices to look even further ahead. Until 2017, the second-most-populous state projected revenues and spending only through the upcoming biennial budget, but a change in statutes now require that the Legislative Budget Board to report estimated revenues and expenses through 2029.16
Budget Maneuvers
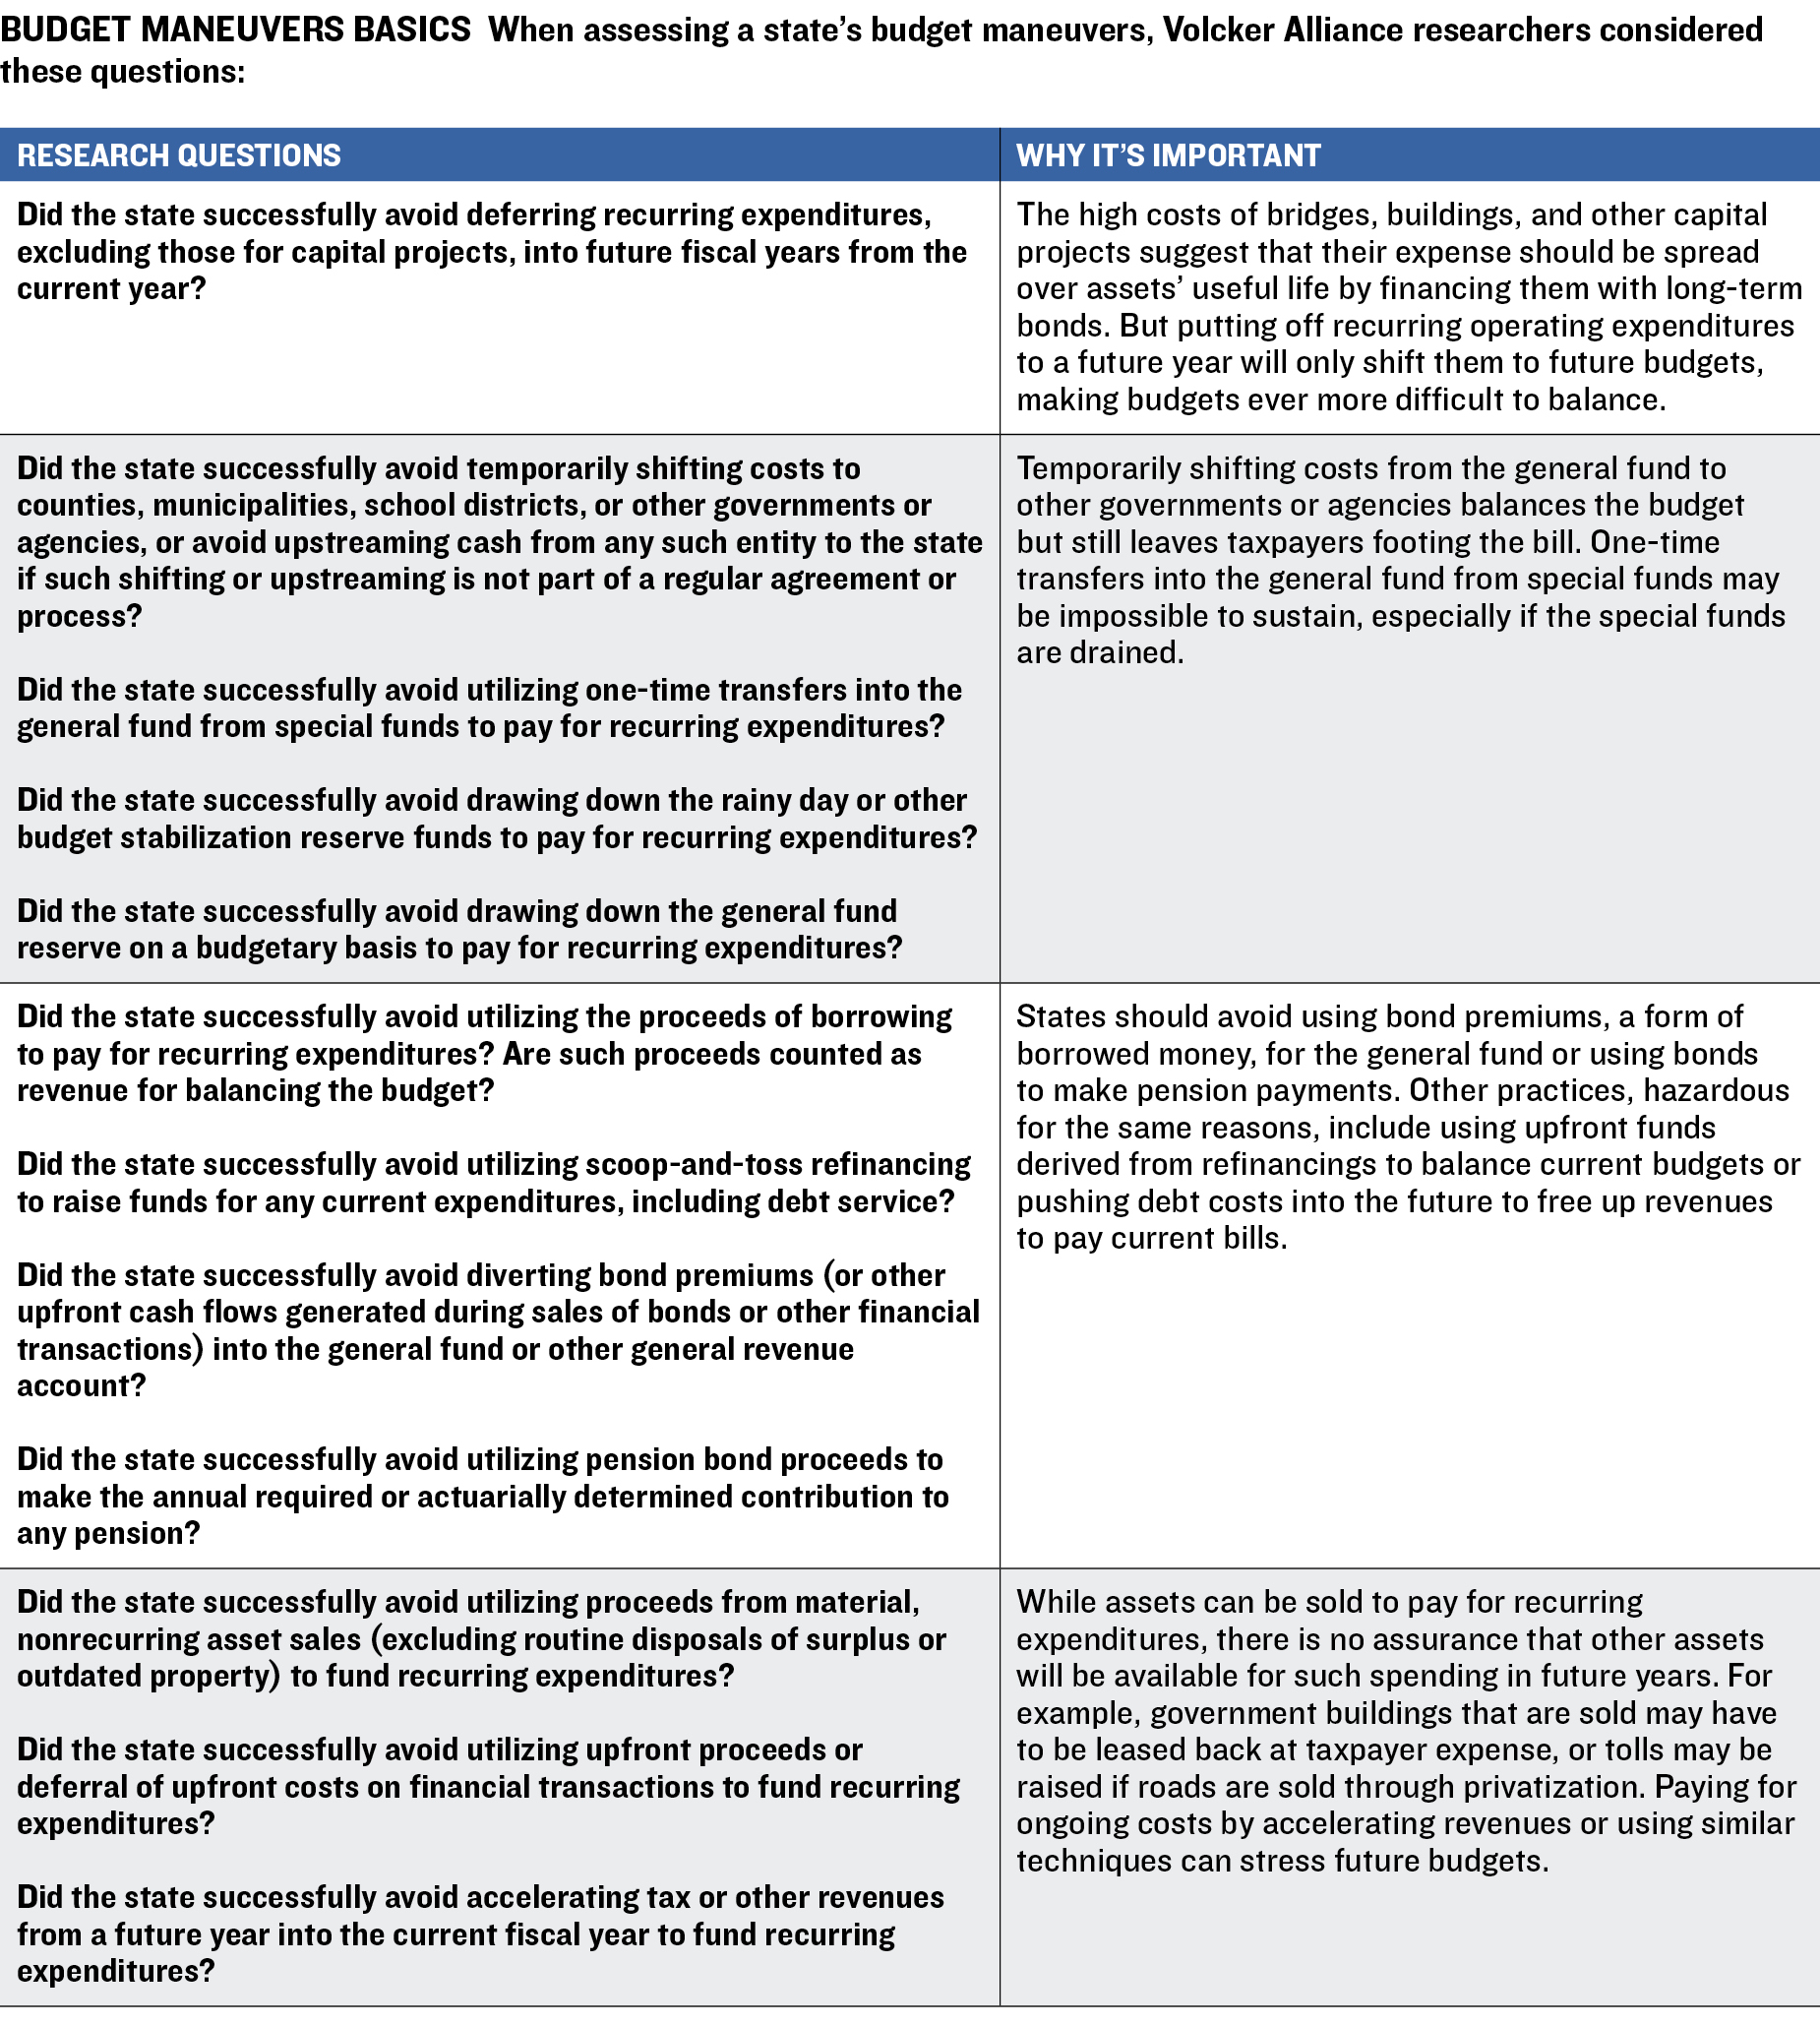
States may resort to budget maneuvers when a current year’s revenues fall short of budgeted expenditures. Such techniques merely shift obligations to future years without addressing structural budget deficits. Major budget maneuvers include funding recurring expenses with debt or asset sales; deferring recurring expenditures; or shifting revenues or costs in other ways—for example, by tapping special funds that have been established for energy, transportation, or other services to bolster general fund spending and achieve budgetary balance.
The averages of Colorado, Kansas, Michigan, Mississippi, and Washington in the budget maneuvers category improved in fiscal 2017–19 from the previous three-year evaluation period, while those of Arkansas, Illinois, Kentucky, and New York dropped.
Only one state—Pennsylvania, which posted a bottom-dwelling average of D-minus—received no credit in any of the five indicators in budget maneuvers. Its tactics included using debt to fund recurring noncapital expenses. For example, the state used $41.1 million of proceeds from a sale of general obligation bonds in 2018 to pay capitalized interest on the debt in fiscal 2019 that should have been paid from operating revenues.17 Pennsylvania also used $1.5 billion in proceeds from a 2018 issue of Tobacco Master Settlement Agreement payment revenue bonds to cover a “significant” negative balance in the general fund at the end of fiscal 2016–17 resulting from revenue shortfalls and bigger-than-expected tax refunds.18 In addition, the proceeds were used to pay about $90 million in interest on tobacco bonds that was due in fiscal 2018 and 2019.19 (The 1998 tobacco agreement provides annual payments in perpetuity from cigarette manufacturers to forty-six states, the District of Columbia, and US territories.20 )
Revenue and cost-shifting are by far the most widely used budget maneuvers. Nineteen states used at least one of the techniques to help balance budgets from fiscal 2017 through 2019. In Kansas, for example, transfers from the highway fund to the general fund occurred in each year, reaching a high of $293.1 million in 2019.21 Most of those highway funds came from motor fuel and sales taxes that were originally designed to support roads. New Jersey took a similar diversionary path for several years. For instance, in 2018 the state appropriated $82 million from the Clean Energy Program to replace general fund appropriations for New Jersey Transit Corporation utility costs.22
Among the eight states deferring recurring expenditures each year in fiscal 2017–19, Illinois was unquestionably the most extreme case. It has routinely delayed vendor payments for many years, with unpaid bills reaching a high of $16.7 billion in November 2017.23 The amount owed has declined substantially since then, to $6.7 billion as of January 2020.24 But this was partially accomplished through the use of general obligation bonds to cover debts, effectively converting short-term liabilities into ones that will last for a decade.
Illinois was also one of six states that included proceeds from sales of public assets or upfront proceeds on financial transactions to help balance budgets in 2018 and 2019. The others were New Jersey, New York, Pennsylvania, Texas, and Virginia. New York, Pennsylvania, and Virginia did so for an additional year, 2017. Illinois included $300 million in revenues from the planned sale of the James R. Thompson Center, a state office building in Chicago, in the 2018 budget and inserted the same figure in the 2019 budget when the transaction did not occur.25 A windfall in corporate and individual tax revenues helped save the state from cutting expenses to fill the gap left by the failure of the center to sell.26
Legacy costs, including public worker pension and OPEB, largely health care, are probably states’ largest long-term financial burdens. Many states face deficits resulting from their failure to follow actuarial recommendations for fully providing for promised retirement benefits.
While rising stock prices helped state pension systems improve their funding to a total of 70.1 percent of promised obligations in 2018 from 66.3 percent in 2016,27 many pensions still do not meet their assumed returns. This indicates that the cumulative deficit will continue to grow unless benefits are reduced, government or worker contributions are increased, or some combination of the three is implemented. (We have used 2018 pension funding data in calculating legacy cost grades for 2019.)
The way to eliminate long-term unfunded retirement liabilities over time is to deposit a so-called actuarially determined contribution (ADC) into pension funds each year. Yet twelve states, including California, Texas, and Virginia, failed to pay their full ADC in one of the three years evaluated.
The lack of annual actuarial funding for OPEB is even more troublesome. Twenty-six states failed to meet their ADC in all three years from fiscal 2017 through 2019. While some states had small OPEB liabilities, others have enormous long-term obligations. Though California’s OPEB liabilities fell by $5.4 billion from 2017, its plan showed a deficit of $85.6 billion as of June 30, 2018.28 That is equivalent to $2,100 for every resident of the nation’s most-populous state.
Even worse on a per capita basis is South Carolina. Its OPEB plan had a net liability of $15.1 billion as of June 30, 2019,29 equivalent to $2,600 for each resident. (Like many states, California and South Carolina provide funding for OPEB largely on a pay-as-you-go basis rather than providing adequate funding as benefits are earned each year.)
All but eight states retained the same average mark in legacy costs for 2017–19 that they had scored for 2016–18. California was the only state whose average dropped, to D-minus from D. Averages rose for the remaining seven: Georgia, Kentucky, Maine, Maryland, Minnesota, Virginia, and Washington. For example, Minnesota’s average rose to C from D. Its pension funding ratio jumped by 10.1 percentage points between fiscal 2016 and 2017 and another 18.5 in fiscal 2018. That left the state with a funding level of 81.8 percent in 2018.
The C average of all states represents a broad spectrum of grades: ten top As; nine Bs; fourteen Cs; ten Ds; and seven D-minuses, the lowest possible mark.
Among US Census regions, the Mid-Atlantic and East South Central states were the only areas in which no state averaged an A. New England did the worst in general, with four of the six states posting a D or D-minus. Maine was the only New England state to average an A. It contributed 100 percent or more of the ADC to its pension plan in fiscal 2017–19 and had a funded ratio of 84.5 percent in 2018. Its annual contributions for OPEB over the period were also in line with actuarially determined amounts.
Making annual contributions is of great importance for states, as it can take years or decades to compensate for appropriations that are skipped or below actuarial recommendations. For example, Vermont’s pensions are 64 percent funded, 6 points below the total for all states. Even though the state has been making 100 percent of its ADC since at least 2015, it frequently underfunded the contributions in the past. From 1997 to 2006, it never made the full contribution. Its contribution in 2004 was just 67 percent of the amount needed to achieve full funding over time.30 Overall, of the fifteen states with pensions less than 65 percent funded in 2018, ten paid their full ADC in each year evaluated. Their budgets will for many years bear the weight of making up for previously missed contributions.
“Rainy day funds are the savings accounts of US states,” the Volcker Alliance stated in Rainy Day Fund Strategies: A Call to Action.31 Thanks to the robust economy of the past several years, states have had money to add to their reserves, which are used to support spending during economic downturns, natural disasters, public health threats, and other emergencies.
Moody’s Investors Service projects that state revenue growth will slow to 4 percent in 2020 from 4.9 percent in 2019. While that is under the average annual growth rate, in nominal dollars, of 5.4 percent from 1979 through 2017,32 even the slower pace estimated is likely to support continued growth in rainy day funds at least for the year.33
Reserve funds and budget maneuvers contained the highest number of three-year A averages. Eighteen states earned the top grade in these categories—the two that benefit most from a healthy economy.
Only Connecticut and Montana improved their average in the reserve funds category from the previous three-year period. Connecticut’s average rose to A for 2017–19 from B in 2016–18 thanks to 2017 legislation that incorporated revenue volatility into its rainy day funding policy. Under the law, personal income tax collections above a certain amount must be deposited into the Budget Reserve Fund. The cap was set at $3.1 billion for 2019 and $3.3 billion for 2020.34
Montana’s average rose to B from C because of policies established in 2017 that adhere closely to best practices cited in Rainy Day Fund Strategies: A Call to Action. Montana’s new law details appropriate uses of rainy day fund dollars as well as a process for replenishment. It is also one of twenty-one states that tie rainy day funding to historical revenue volatility.35
Kansas and Illinois were the only states to receive D averages in reserve funds for 2017–19. While Kansas passed a law in 2016 establishing a rainy day fund, the legislature has repeatedly delayed putting any money into it.36 As of fiscal 2019, Kansas had yet to create policies for appropriate replenishment and disbursement of its rainy day fund. Meanwhile, Illinois’s Budget Stabilization Fund exists almost exclusively on paper. As of fiscal 2019 it totaled $4 million, equivalent to about 32 cents for every man, woman, and child in the state.37
Twenty-nine states just missed A averages in the category, partly because they do not take steps to tie rainy day fund deposits or balances to historical revenue volatility. This linkage is typically established through an economic formula, a budgetary formula, a revenue volatility analysis, or by tapping volatile revenue streams. In Oklahoma, for example, general revenue fund collections beyond 100 percent of the amount estimated at the beginning of the fiscal year must be deposited into the Constitutional Reserve Fund until it reaches a cap specified by the constitution. The cap is currently set at 15 percent of the present year’s estimated state revenue.38
States should explain fully to the public how they project, develop, and balance budgets. Without such transparency, citizens are far less able to hold public officials accountable.39
Transparency once involved little more than making official documents available to the public and the press. But as the internet has become a home for any resource a state chooses to put online, far more information can be accessed with a click. Arkansas was the only state that lost credit because of its lack of a consolidated budget website. Still, only four states—Alaska, California, Hawaii, and Tennessee—earned A averages. They were the only ones providing information on deferred infrastructure maintenance costs to the public for all three years of the evaluation period. (Illinois began comprehensive disclosure of this information in 2019.)
Disclosure of such infrastructure data is critical to assessing spending needs and balancing a budget. According to America’s Trillion-Dollar Repair Bill: Capital Budgeting and the Disclosure of State Infrastructure Needs, “The cost of making deferred repairs at the state level may be as large as $873 billion, equivalent to 4.2 percent of US gross domestic product, or almost three times the value of all investment by states and localities in nonresidential fixed assets.”40
Eight states posted C averages, the lowest grade given in this category: Arkansas, Iowa, Missouri, North Dakota, South Carolina, Utah, Virginia, and Wyoming. Arkansas’s grade marked an improvement over the 2016–18 evaluation, when it was the only state to average D in the category. The modest improvement reflects efforts to upgrade its reporting of tax expenditures. In 2018, it disclosed the cost to the state of a wide range of such expenditures, including business incentives and tax credits.41 A year later, Arkansas further enhanced its reporting practices under a new statute requiring biennial reporting of the cost of “exemptions, discounts, credits, and deductions relating to income tax and sales and use tax.”42
The other C-graded states failed to provide comprehensive tax expenditure reports, which are essential to understanding the amount a state is handing out in abatements, deductions, credits, and exemptions. Some states in this group, such as Missouri and Utah, provide a degree of tax expenditure information but fell short of comprehensive disclosure.
The Governmental Accounting Standards Board, which sets standard for state and local financial reporting, has required disclosure of some tax abatements in comprehensive annual financial reports beginning in December 2015. But its Statement No. 77 focuses on abatements given to individuals or companies in exchange for specific actions, while leaving out more general tax exemptions or credits that typically appear in states’ budgetary disclosures.43
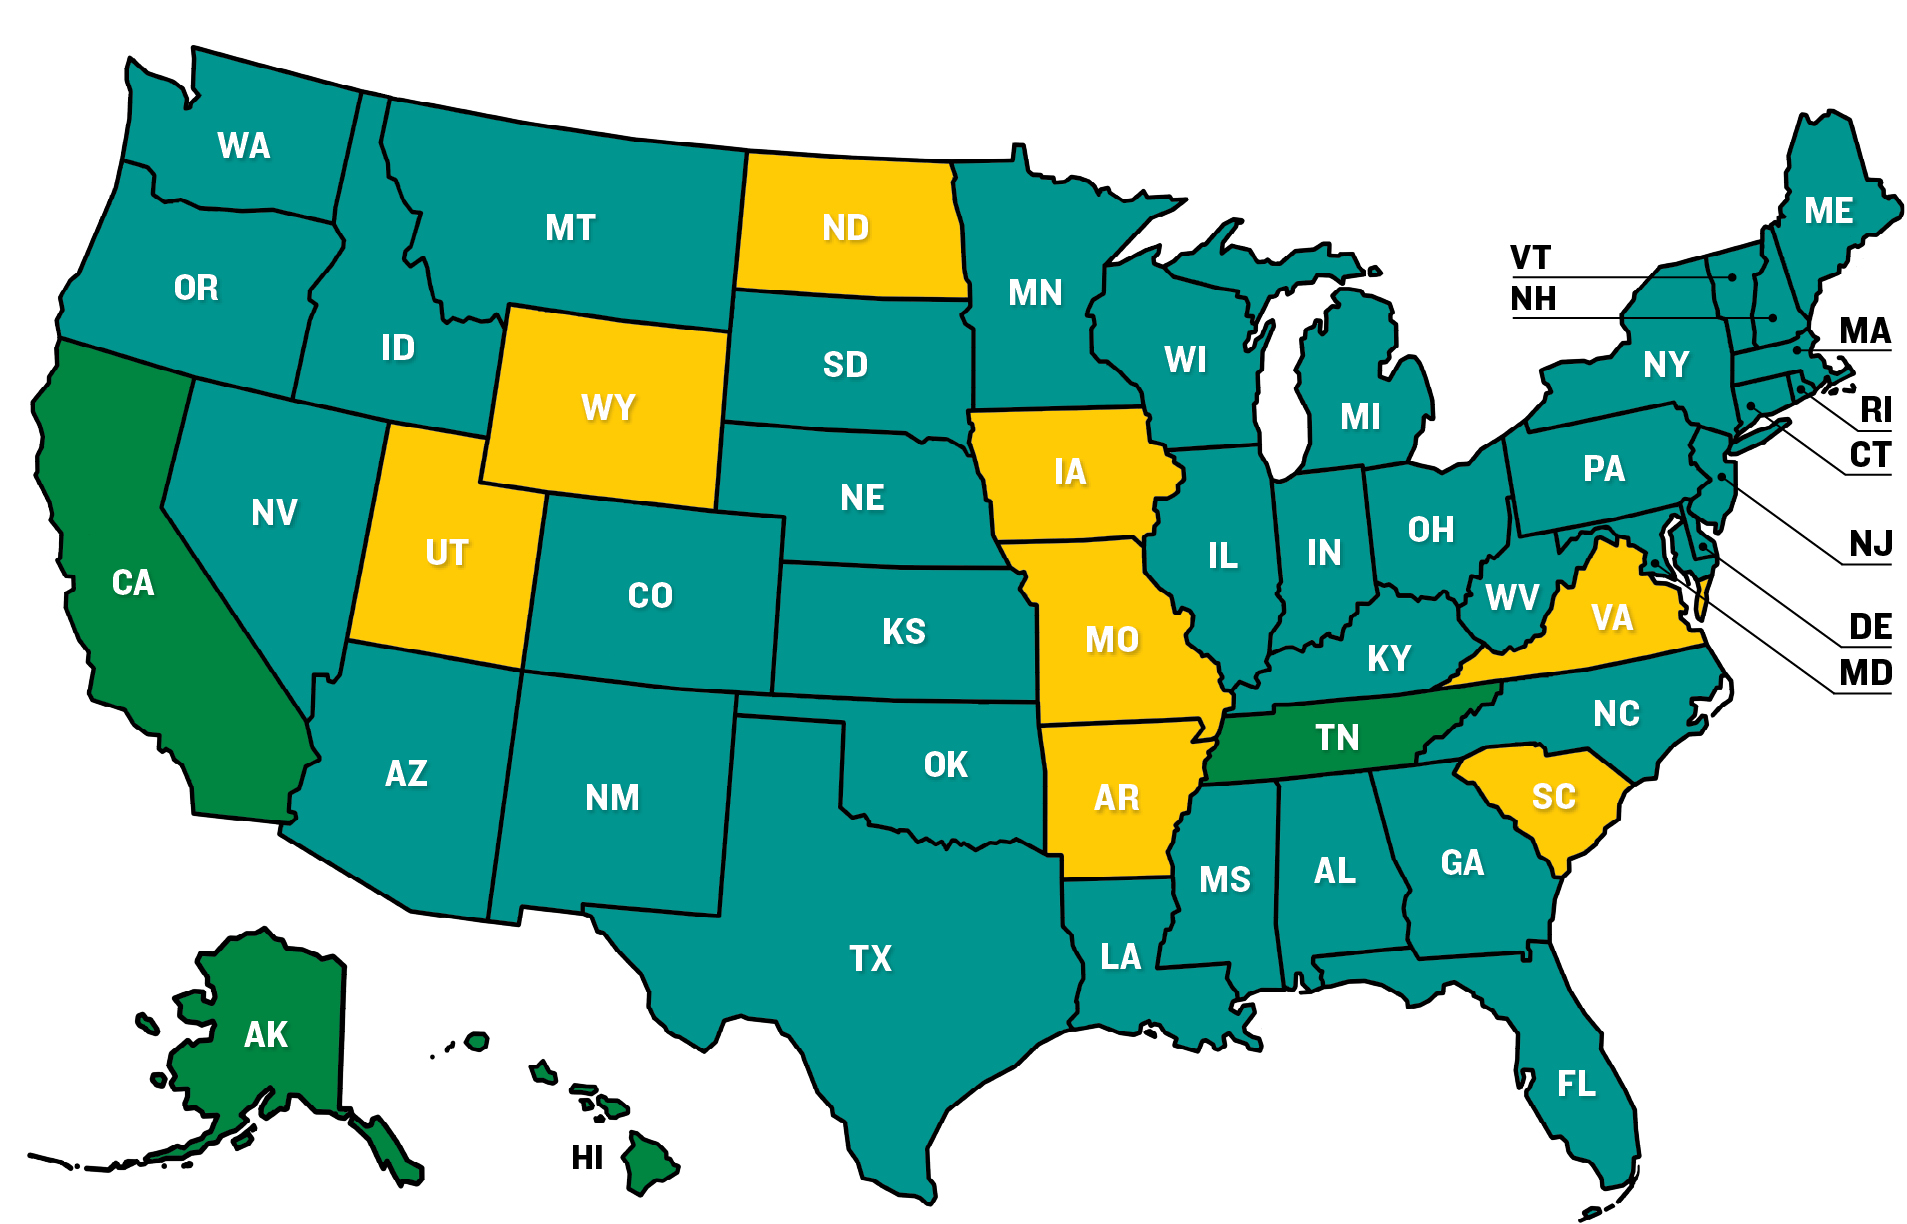
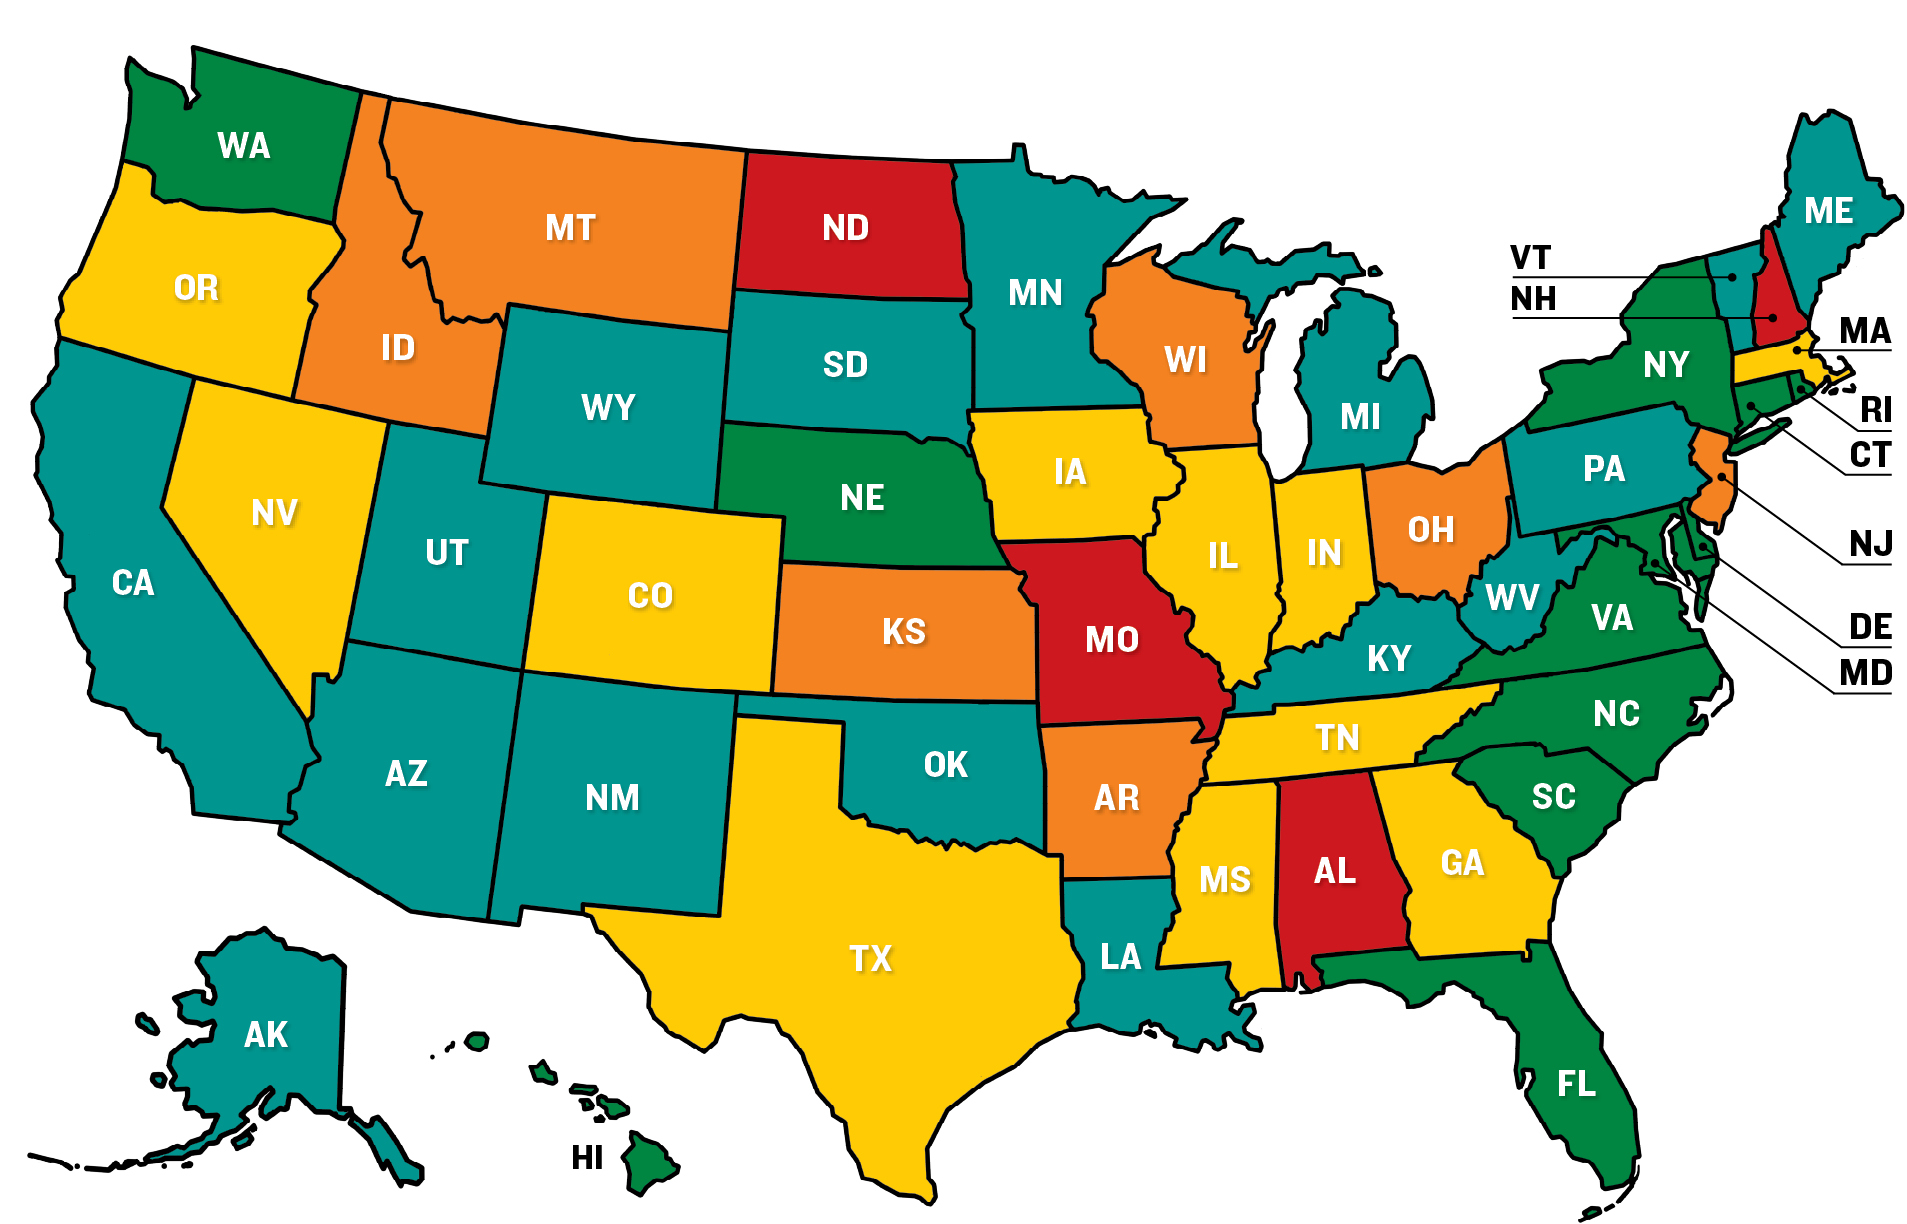
Fifty State Report Cards
The report cards, which can be accessed by clicking the map at the bottom of the page, contain each state’s average grades in all five budgetary categories for fiscal 2017 through 2019, along with their annual marks. The report cards also contain explanations of the principal drivers of each state’s grades, as well as comparisons with results in neighboring states.
Endnotes
1. National Bureau of Economic Research, US Business Cycle Expansions and Contractions, link.
2. National Association of State Budget Officers, 2019 State Expenditure Report, 1, link.
3. Jerry Zhirong Zhao, Camila Fonseca-Sarmiento, and Jie Tan, America’s Trillion-Dollar Repair Bill: Capital Budgeting and the Disclosure of State Infrastructure Needs, Volcker Alliance, November 2019, 1, link.
4. William Glasgall, “Six Principles of Better Budgeting,” Capitol Ideas, Council of State Governments, March/April, 2017, link.
5. Dall W. Forsythe, “Cyclical Budget Management in New York City,” prepared for delivery at the Public Budgeting and Finance Section of the Western Social Science Association, April 30, 2006, 2–3, link.
6. National Association of State Budget Officers, The Fiscal Survey of States, Spring 2019, vii, link.
7. Katherine Barrett and Richard Greene, Rainy Day Fund Strategies: A Call to Action, Volcker Alliance, July 2019, 13, link.
8. National Association of State Budget Officers. The Fiscal Survey of States, Fall 2019, ix, link.
9. Comptroller of Maryland, Board of Revenue Estimates, link.
10. Pew Charitable Trusts, Managing Volatile Tax Collections in State Revenue Forecasts, March 2015, 13, link.
11. Erica MacKellar, “Revenue Estimating in the States,” Legisbrief 24, no. 12 (March 2016): 1, link.
12. 2019 Florida Statutes, § 216.133-216-134, link.
13. Alabama Executive Budget Office, Budget Formulation, link.
14. North Dakota Legislative Branch, North Dakota’s Revenue Forecasting Process, link.
15. North Carolina General Assembly § 143C-3-5, budget recommendations and budget message, 2019, link.
16. Texas Legislative Budget Board, Cost Drivers and Revenues: Ten-Year Trend, February 2017, link.
17. Commonwealth of Pennsylvania, General Obligation Bonds, First Series of 2018, May 16, 2018, 8, link.
18. Commonwealth Financing Authority, Tobacco Master Settlement Payment Revenue Bonds, Series 2018, 1, February 13, 2018, link.
19. Tobacco Master Settlement Payment Revenue Bonds, Series 2018, 25 , link.
20. Tobacco Master Settlement Payment Revenue Bonds, Series 2018, 50, link.
21. State of Kansas, Comparison Report, FY 2019 Governor’s Budget Report with Legislative Authorizations, Governor’s Office, 25, link.
22. State of New Jersey Office of the Governor, Building a Stronger and Fairer New Jersey, Governor’s FY 2019 Budget, March 13, 2018, D-369, link.
23. Illinois State Comptroller, Backlog Voucher Report, link.
24. Backlog Voucher Report, link.
25. Commission on Government Forecasting and Accountability, State of Illinois Budget Summary, FY 2019, August 1, 2018, 22, link.
26. Dan Petrella, “Gov. J.B. Pritzker may seek public-private partnership to facilitate sale of Thompson,” State Journal-Register, August 30, 2019, link.
27. Bloomberg data prepared for the Volcker Alliance, September 6, 2019.
28. California State Controller, “Controller Yee Updates State Retiree Health Care Liability,” press release, May 15, 2019, link.
29. South Carolina Office of the State Auditor, South Carolina Public Employee Benefit Authority, Insurance Benefits and Other Postemployment Benefits Trust Funds Audited Financial Statements Year Ended June 30, 2019, October 15, 2019, 18, link.
30. Pew Charitable Trusts, Promises with a Price: Public Sector Retirement Benefits, December 2007, 64, link.
31. Barrett and Greene, Rainy Day Fund Strategies, 1, link.
32. The Fiscal Survey of States, Fall 2019, 45, link.
33. Moody’s Investors Service, Credit Outlook, 25, December 5, 2019.
34. Connecticut Office of Legislative Research, Connecticut’s Volatility Cap, December 7, 2018, link.
35. Montana Code Ann. 2019, 17-7-130, Budget Stabilization Reserve Fund—Rules for Deposits and Transfers, link.
36. State of Kansas, 2016 Session Laws of Kansas Vol. 2, July 1, 2016. 1187–88, link.
37. The Fiscal Survey of States, 71, Fall 2019, link.
38. Oklahoma Policy Institute. Rainy Day Fund, link.
39. Ballotpedia, Government Transparency, link.
40. Zhao, Fonseca-Sarmiento, and Tan, America’s Trillion-Dollar Repair Bill, 1.
41. Arkansas Department of Finance and Administration, Business Incentives and Credits, link.
42. State of Arkansas 92nd General Assembly Regular Session, 2019, Senate Bill 561, March 2019, link.
43. Norton Francis, GASB 77: Reporting Rules on Tax Abatements, Economic Development Strategies, Information Brief 1, Urban Institute, October 2015, link.
The research for this report was conducted by professors and graduate students at City University of New York; Florida International University; Georgia State University; University of California, Berkeley; University of Kentucky; the Chicago and Springfield campuses of University of Illinois; and University of Utah. The schools’ efforts were augmented by Volcker Alliance staff, data consultants at the research firm Municipal Market Analytics, and special project consultants Katherine Barrett and Richard Greene. The Volcker Alliance is thankful to all of the research partners who helped make this report possible.
Select a State Below to View State Report Cards and Budget Sources
- National Organizations and Federal Agencies
- Alabama
- Alaska
- Arizona
- Arkansas
- California
- Colorado
- Connecticut
- Delaware
- Florida
- Georgia
- Hawaii
- Idaho
- Illinois
- Indiana
- Iowa
- Kansas
- Kentucky
- Louisiana
- Maine
- Maryland
- Massachusetts
- Michigan
- Minnesota
- Mississippi
- Missouri
- Montana
- Nebraska
- Nevada
- New Hampshire
- New Jersey
- New Mexico
- New York
- North Carolina
- North Dakota
- Ohio
- Oklahoma
- Oregon
- Pennsylvania
- Rhode Island
- South Carolina
- South Dakota
- Tennessee
- Texas
- Utah
- Vermont
- Virginia
- Washington
- West Virginia
- Wisconsin
- Wyoming