State Budgeting Grades Map: Data Set and Interactive Visualization

Results for Fiscal 2015, 2016, 2017, 2018, and 2019
Explore the State Grades and Budgeting Practice Indicator Results Data
Using the Truth and Integrity in State Budgeting Data Laboratory
Explore the Data
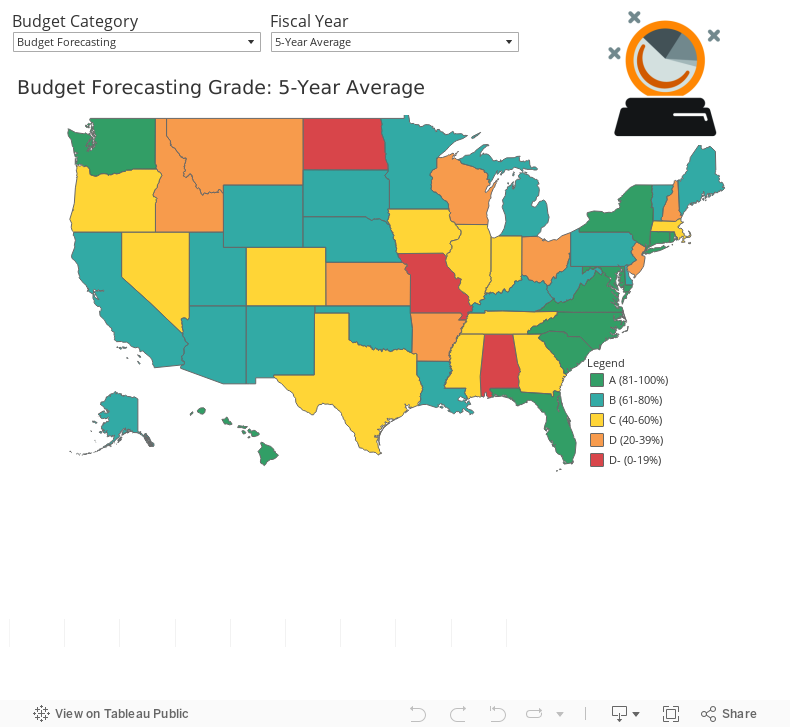
The Volcker Alliance evaluated all fifty states' adherence to best practices on a set of nineteen common budget practice indicators and assigned grades to each state within five budgeting categories: Budget Forecasting, Budget Maneuvers, Legacy Costs, Reserve Funds, and Transparency.
Select a Fiscal Year (or 5-Year Average) and a budget category on the data visualization below to view a color coded map of the budget category grades that each state earned.
Select a state by clicking the map to explore the components resulting in the selected state's grade: whether each state followed or failed to follow best budgeting practices in each of the budgeting practice indicators over the five fiscal years studied, 2015 through 2019.
Refresh the page to return to the default view.
Explore the Budgeting Grades Map
Explore More State Budgeting Results
State Budgeting Practice Indicator Results: Data Set and Interactive Visualization
State Budgeting Practice Indicator Results: Data Set and Interactive Visualization
State Budgeting Category Grades: Data Set and Interactive Visualization
State Budgeting Category Grades: Data Set and Interactive Visualization
State Budgeting Category Grade Rankings: Data Set and Interactive Visualization
State Budgeting Category Grade Rankings: Data Set and Interactive Visualization
State Budgeting Category Grade Distribution: Data Set and Interactive Visualization
State Budgeting Category Grade Distribution: Data Set and Interactive Visualization
State Budgeting Grades: Data Set and Interactive Visualization
State Budgeting Grades: Data Set and Interactive Visualization
State Employee Pension Funding: Data Set and Interactive Visualization
State Employee Pension Funding: Data Set and Interactive Visualization
Download the Data
You can download the data set as a spreadsheet file, including all the budgeting practice indicator results and category grades for all 50 states for fiscal years 2015-2019, by using the 'Download Data' button at the top right of this page.
About the Budgeting Practice Indicators and State Grades
How the States' Budgeting Practices were Assessed and Graded
In the Truth and Integrity in State Budgeting: Preparing for the Storm report covering all fifty states over the fiscal years of 2015 through 2019, the Volcker Alliance focuses on five critical areas that explain methods used to achieve budgetary balance, as well as how budgets and other financial information are disclosed to the public.
- procedures in developing and presenting annual (or in some instances biennial) budgets, including the extension of reliable revenue and spending estimates over periods beyond the annual budget;
- use of ad hoc, one-off adjustments of revenues and expenditures at the expense of future budgets;
- practices with respect to funding (or failure to fund) pensions and OPEB (other post-employment benefits, including health care) for public employees—quantitatively by far the most important area of this study for most states;
- provisions for, and responsible use and replenishment of, rainy day funds and other fiscal reserves;
- and comprehensiveness of disclosure of budgetary information, including tax expenditures and infrastructure replacement costs.
In each category identified below, a state was given a grade ranging from A to D-minus. Although there are no “failed states,” the results, as might be expected, cover a wide spectrum, with especially excellent or weak performances scattered across the nation.
Budget Forecasting evaluates whether and how states estimated long-term revenue and expenditure trends.
Budget Maneuvers evaluates whether states used one-time revenues, borrowings, asset sales, and other measures to achieve short-term budgetary balance.
Legacy Costs evaluates whether states provided adequate funding, as defined by retirement system actuaries, for pensions and other promised retirement benefits for public workers. The Legacy Costs budgeting category grade was modified to also take into account any unfunded pension liabilities (pension funding ratios were compiled by Bloomberg as of the end of the fiscal year in question).
Reserve Funds evaluates states’ rainy day funds and other fiscal reserves, as well as any policies governing their use and replenishment.
Transparency evaluates the accessibility to the public of states’ budget practices.
- Budget Category Grade Key:
- A = Scored 81%-100%
- B = Scored 61%-80%
- C = Scored 40%-60%
- D = Scored 20%-39%
- D- = Scored 0%-19%
While we attempted to keep the scoring and grading systems as simple as possible, some variation among budget categories was necessary to most accurately reflect states’ success in implementing budgetary best practices. Save for legacy costs, which was assessed on three factors, categories were scored on the adherence to best practices on four equally weighted budget indicators, each measured by a research question or set of related questions. Here is how we determined the grades:
- The Budget Forecasting category was graded on a state’s use of a consensus revenue forecast; having a reasonable rationale for revenue growth projections (based on historical revenue and economic growth trends); producing multiyear revenue forecasts; and generating multiyear expenditure forecasts.
- The Budget Maneuvers category was graded on a state’s use of one-time actions to create short-term budget fixes, often to the detriment of long-term budget sustainability. Research questions related to one-time actions were grouped into four types of budget maneuvers, and states received credit for each type they succeeded in avoiding. One-time actions included funding recurring expenses with debt; funding recurring expenses with the proceeds of asset sales or by tapping future revenues; deferring a current year’s recurring expenditures; and covering general fund expenditures with transfers from other funds.
- The Legacy Costs category was graded on a state’s willingness to meet public employee pension obligations and other postemployment benefit (OPEB ) obligations. Thirty percent of a grade was determined by a state’s actuarially required or determined contribution (ARC or ADC ) for OPEB . Thirty-five percent of the category grade was based on whether the state made its public employee pension ARC or ADC , and 35 percent was based on the state’s pension funding ratio, which represents the amount of assets available to cover promised benefits. While it is best for states to make the full payment that actuaries determine is necessary every year, missing such a contribution is of greatest concern to states with high unfunded liabilities.
- The Reserve Funds category was graded on a state having a reserve fund disbursement policy; having a reserve fund replenishment policy; tying reserves to historic trends in revenue volatility; and having a positive reserve or general fund balance at the beginning of each fiscal year.
- The Transparency category was graded on the extensiveness and usefulness of a state’s financial disclosure practices. States received credit for having a consolidated budget website; disclosing outstanding debt and debt service cost tables; providing information on deferred infrastructure maintenance costs; and providing cost estimates for tax expenditures.
Project Background
TRUTH AND INTEGRITY IN STATE BUDGETING: PREPARING FOR THE STORM

State fiscal sustainability is of no small concern to the US economy or the federal government. As Volcker Alliance founder Paul A. Volcker stated in 2017, “The purposes and manner in which public funds are spent are matters basic to our well-being as a nation.” Indeed, states generate $2.6 trillion in annual revenue, equivalent to about 13 percent of the nation’s gross domestic product. State and local governments—the latter heavily dependent on state budget funding—employ almost twenty million people.
While states benefited mightily from the longest economic recovery since the mid-nineteenth century, their advances were often tempered by deeply rooted fiscal challenges. Faced with constitutional, statutory, or customary requirements for annually balanced budgets, many states were forced to reduce or reallocate spending even amid the recovery in GDP and tax revenues. The potential to defer or obfuscate in making these adjustments is very real. That is why the need for comprehensive and accurate accounting and transparent reporting of the financial positions of individual states is even more compelling.
During the period covered in the Truth and Integrity in State Budgeting research project, fiscal 2015 through 2019, many states took advantage of economic recovery and growing tax revenues to strengthen their budget processes as well as their rainy day funds and other emergency cash reserves. While no one could have foreseen the public health, economic, and fiscal stresses caused by the onset in 2020 of the COVID-19 pandemic, actions taken by states during the boom times for employment and GDP left many better prepared for hard times than they were only a few years earlier.
In Truth and Integrity in State Budgeting: Preparing for the Storm, a report released in March 2021 covering all fifty states during fiscal 2015 through 2019, the Volcker Alliance focuses on five critical areas that explain methods used to achieve budgetary balance, as well as how budgets and other financial information are disclosed to the public. States were given grades of A to D-minus for their procedures in:
- Budget forecasting – how and whether states estimate revenues and expenditures for the coming fiscal year and the long term;
- Budget maneuvers – primarily how much states depend on one-time actions to offset recurring expenditures;
- Legacy costs – how well states are funding promises made to public employees to cover retirement costs, including pensions and retiree health care;
- Reserve funds – both the health of general fund reserves and rainy-day funds and whether governments have clear rules governing their use, replenishment, and relationship to historic revenue volatility; and,
- Budget transparency – how completely states are disclosing budget information, including debts, tax expenditures, and the estimated cost of deferred infrastructure maintenance.
In addition to assigning grades, the Volcker Alliance proposes a set of best budgeting practices for policymakers to follow.
Critical to this work has been the cooperation of eight universities, each with a strong interest in public finance and public service education. Research was conducted by professors and graduate students at City University of New York; Florida International University; Georgia State University; University of California, Berkeley; University of Kentucky; the Chicago and Springfield campuses of University of Illinois; and University of Utah. The Alliance hopes to assist schools of public policy and administration by helping to widen the scope of research in the areas of public budgeting and finance while training students looking toward careers in state and local governments. The universities’ research efforts were augmented by Volcker Alliance staff, data consultants at Municipal Market Analytics, and special project consultants Katherine Barrett and Richard Greene.

