
Long-Term Strategies to Bolster NYC's Budget Against Potential Cuts in US and State Aid
EXECUTIVE SUMMARY
MORE THAN ONE-THIRD OF New York City’s annual operating budget comes from grants and revenues from New York State or the federal government. These funds pay for vital public services such as education and Medicaid. New York City depends on these state and federal monies for its operating expenses to a larger degree than any of the ten next-biggest cities. This places the city’s operating budget in a precarious position: If these intergovernmental funds were reduced or eliminated, the city would be forced to scramble to fund critical public services.
The recent windfall of COVID-19 relief funds exacerbated these risks for New York City, as some of these temporary dollars were used to cover ongoing and recurring expenditures. Before the money disappears, New York City should take action to prepare its budget and fortify its long-term fiscal well-being. Specifically, the city should pursue long-term fiscal balance through a combination of expenditure reductions and revenue increases, boost deposits into its recently created rainy day fund and put into effect rules for deposits and withdrawals, and prioritize rainy day fund deposits over debt prepayments.
Four Ways to Bolster NYC’s Budget against Fiscal Shocks
• Pursue long-term fiscal balance through expenditure reductions and revenue increases.
• Increase deposits into the recently created rainy day fund.
• Prioritize rainy day fund deposits over debt prepayment.
• Implement rules to manage rainy day fund withdrawals and deposits.
INTRODUCTION
MORE THAN ANY OTHER large US municipality, New York City depends on a robust pipeline of federal and state funding to maintain vital services such as education, public safety, health, and transportation to its 8.5 million residents. In its fiscal 2022 financial plan, over 36 percent of New York City’s $106.5 billion general fund budget was funded by grants or revenues from New York State or the federal government. The city’s capital budget, which totals nearly $20 billion in investments in critical infrastructure, including mass transit, school construction, public housing, and parks, also relies heavily on federal and state dollars.1 While this intergovernmental revenue is critical to the operation of New York City’s service provision to citizens, it is outside the city’s control with respect to size or use. Although the city can levy taxes to raise revenue—an action that requires the approval of the New York State legislature and governor in most cases—intergovernmental revenues are determined entirely by other governments and elected officials. The recent federal aid intended to support the city’s response to the COVID-19 pandemic has the potential to undermine its long-term fiscal health, because the municipality is spending some of these one-time funds on ongoing programs. This may leave New York City on the hook for such spending long after the federal pandemic aid dollars dry up.
In this issue paper we examine New York City’s dependence on intergovernmental revenue and the unique risks that dependence poses for its budget. We describe the purposes of these funds and compare the city’s reliance on intergovernmental revenues to that of other major municipalities. Finally, we recommend that the city fortify its rainy day fund and take other actions to protect the municipal budget and services against potential shocks from the reduction or elimination of intergovernmental revenue streams.
WHY INTERGOVERNMENTAL REVENUE MATTERS
INTERGOVERNMENTAL REVENUE, or transfers from another level of government, are not unique to the US. They are also a common feature of public finance across the globe used to address disparities that arise in fiscal federalism. Because some states and localities may be unable or unwilling to address public needs, federal aid may be necessary to provide particular services at a baseline level. Similarly, localities may have vastly different fiscal capacities, so states may help equalize these differences. Such transfers from wealthier regions to poorer regions may help ensure baseline provisions of services and not penalize residents in poorer areas. Hence, one key rationale for intergovernmental transfers is to overcome fiscal disparities resulting from differences in tax bases or from the willingness of taxing authorities. Such disparities “arise as a result of differences in the mix of populations requiring public services, secular differences in employment, earnings, wealth, and production among the states and localities,” the US General Accountability Office (GAO) has noted.2
Another reason for intergovernmental transfers involves the spillover effects of some government spending. If the benefits of a local public service program extend to people outside a municipality, such transfers might be appropriate to ensure that these services are funded. For example, certain public services such as parks, recreation, and cultural institutions benefit not only the government where the service is located but also nearby governments and residents. Intergovernmental transfers ensure that public goods and services are distributed appropriately and avoid “substantial misallocations in resources, overspending for some services, underspending for other services, poorly served citizens, badly managed service delivery, and poorly structured revenue systems,” John Mikesell, the late Indiana University economist and public finance expert, wrote in 1999.3 Overall, then, intergovernmental transfers are commonly used to enhance equity and address concerns about efficiency.
While such transfers help localities provide important services within a federal system, the downside for local governments is that they have little control over how much revenue they will receive. While it is unlikely that intergovernmental transfers would cease completely and without warning in a given fiscal year, governments that rely on these transfers may not be able to swiftly adjust tax rates or bases to make up for unanticipated reductions in intergovernmental revenue. Further, public services must be provided regardless of whether intergovernmental revenue declines or ceases unexpectedly. If state school aid were reduced because of a state budget issue, localities would not be relieved of providing education services. Expansive reliance on intergovernmental revenue poses significant risks for recipient governments. The consequences are not theoretical. As recently as July 2020, New York State reported withholding billions of dollars in local aid payments because of concerns about its own cash flows spurred by reduced economic activity during the global pandemic.4
INTERGOVERNMENTAL REVENUE: A Vital Part of the NYC Budget
WHILE INTERGOVERNMENTAL REVENUE may partially free a recipient government from the need to directly tap its tax base, it nevertheless subjects municipalities to fiscal shifts beyond their control. There are three primary risks associated with intergovernmental revenue: It exposes recipient public budgets to unexpected interruptions in funding; increases in intergovernmental funding often do not keep pace with cost inflation; and policy shifts can impose changes in how the money must be used.
New York City levies taxes on real property, personal income, sales and use, corporate and unincorporated business income, real property transfers, and mortgages. In 2020, more than 90 percent of the city’s own-source revenues were derived from such taxes, while the remainder came from charges, nongovernmental grants, and other types of aid. Importantly, the state constitution limits local governments (including New York City) from changing the rates levied on most tax bases without the state’s approval; the sole exception is the real property tax. New York City can impose fees and charges to offset public costs imposed by private behavior, but these cannot be imposed or increased simply to raise general revenues.5 On average, only about 26 percent of New York City’s total annual revenues from 1980 through 2020 fell under its direct control through the property tax; the remaining 74 percent was largely outside the direct control of municipal decision makers.
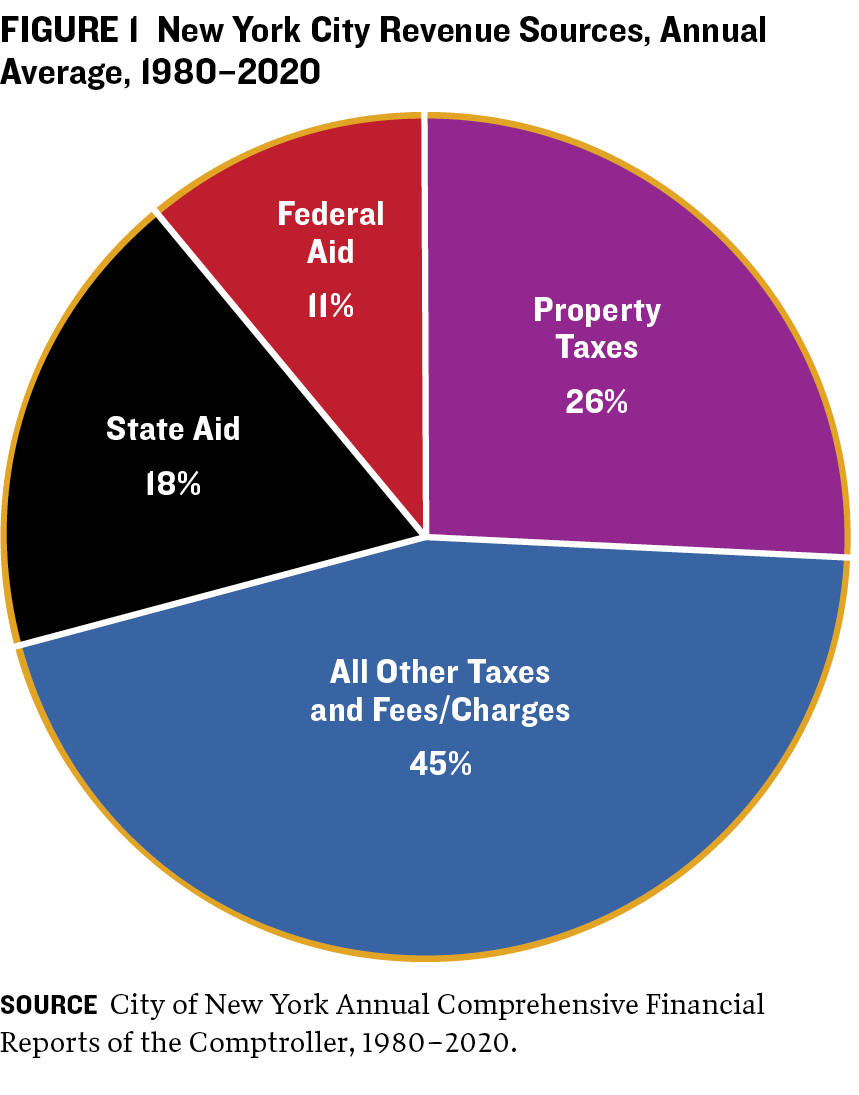 As figure 1 shows, transfers from New York State and the federal government make up a significant portion of New York City’s annual operating budget. In 1980, more than one-third of the city’s annual operating funds came from intergovernmental revenues; the remainder came from own-source revenues—largely property, income, and sales taxes, and fees.
Over time, the city’s own-source revenues have risen significantly compared with state or federal aid and make up a greater share of its overall funds (figure 2). Increases in own-source revenue have also resulted from higher tax rates (such as property taxes) and growth in specific bases (such as property valuations, income, and mortgages) that benefited the city’s budget in the long recovery from the 2007–09 recession. In 2020, for example, about three-quarters of revenues were derived from own-sources and the remaining one-quarter from intergovernmental funds. Even so, intergovernmental revenue consistently makes up a substantial portion of New York City’s budget.
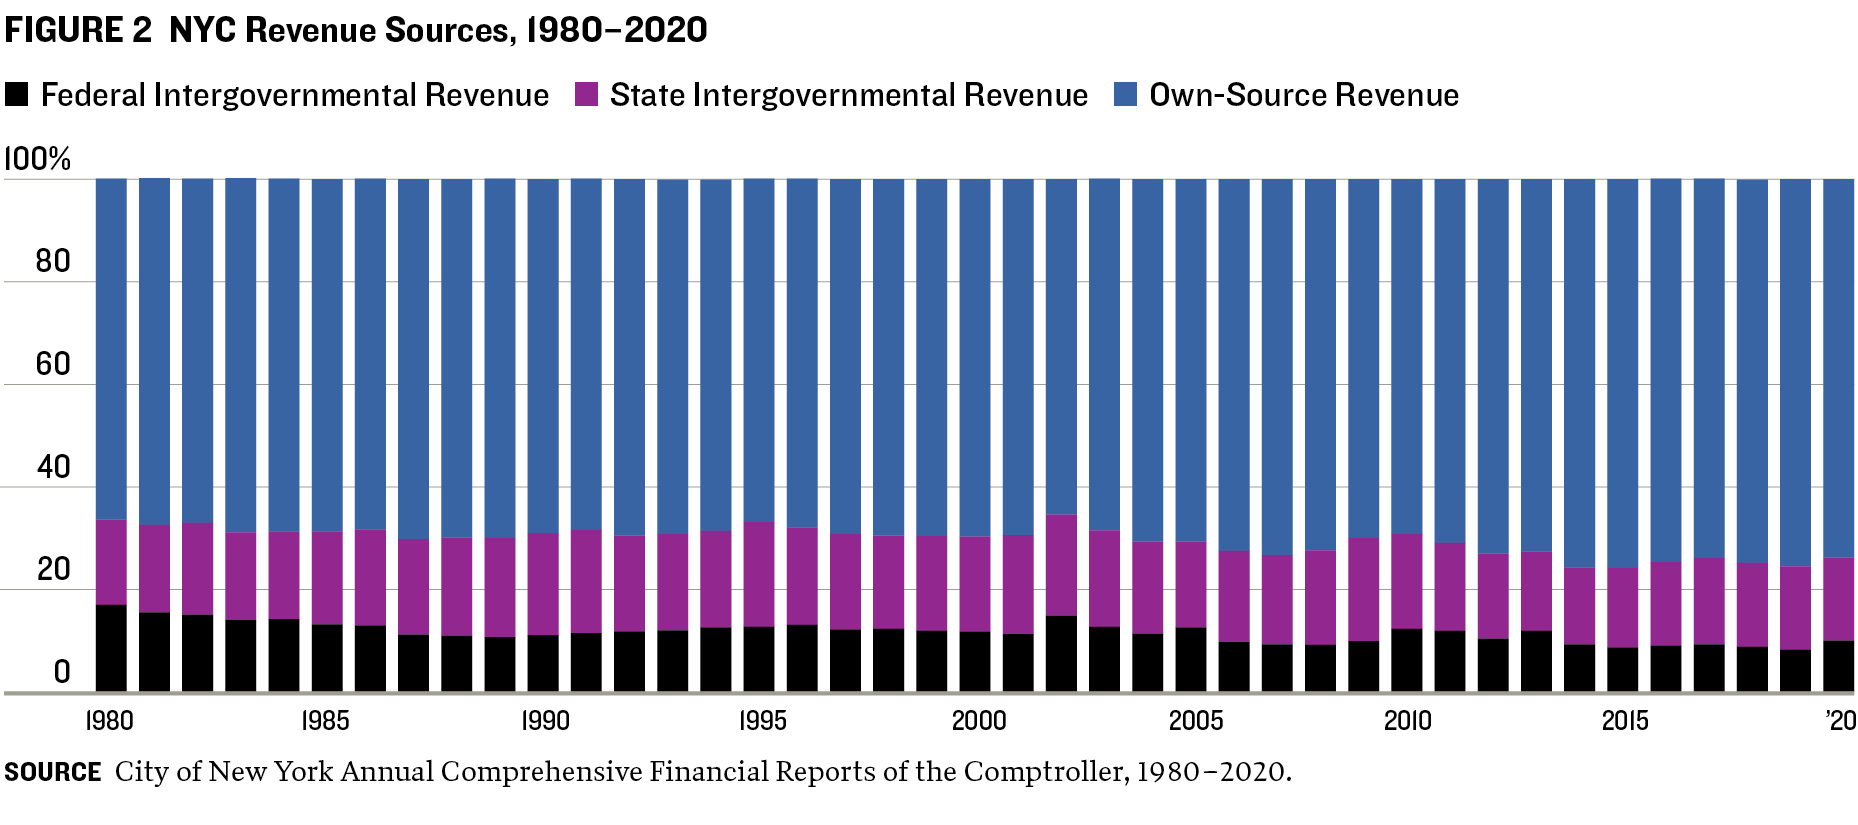
New York City’s dependence on intergovernmental revenue has also declined because of a shrinkage in federal revenues. While federal intergovernmental revenue made up about 17 percent of the city’s revenues in 1980, it had fallen to just 10 percent in 2020. Over the same period, state intergovernmental revenue’s share of the budget has fluctuated at 15 percent-20 percent of the budget.
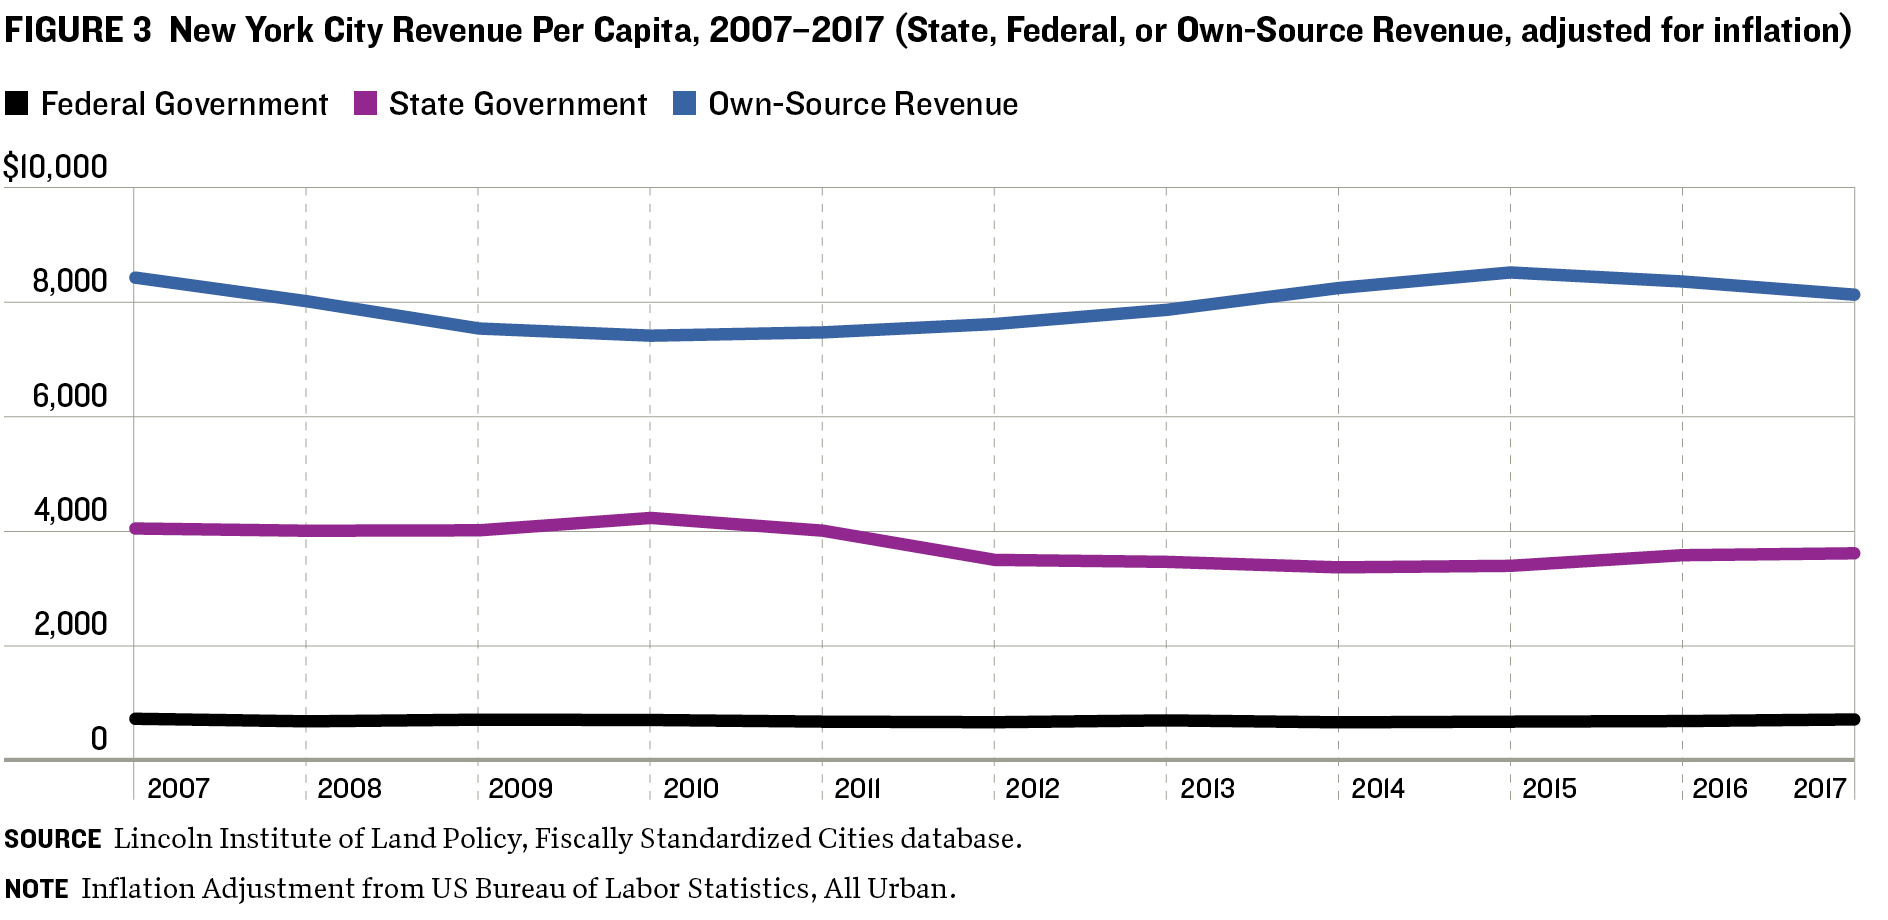
On a per capita basis (figure 3), total intergovernmental revenues to New York City increased about 7 percent in 2007–17, while own-source revenues rose about 14 percent. Accounting for inflation, intergovernmental revenues fell about 10 percent during the period, while own-source revenues have declined about 4 percent.
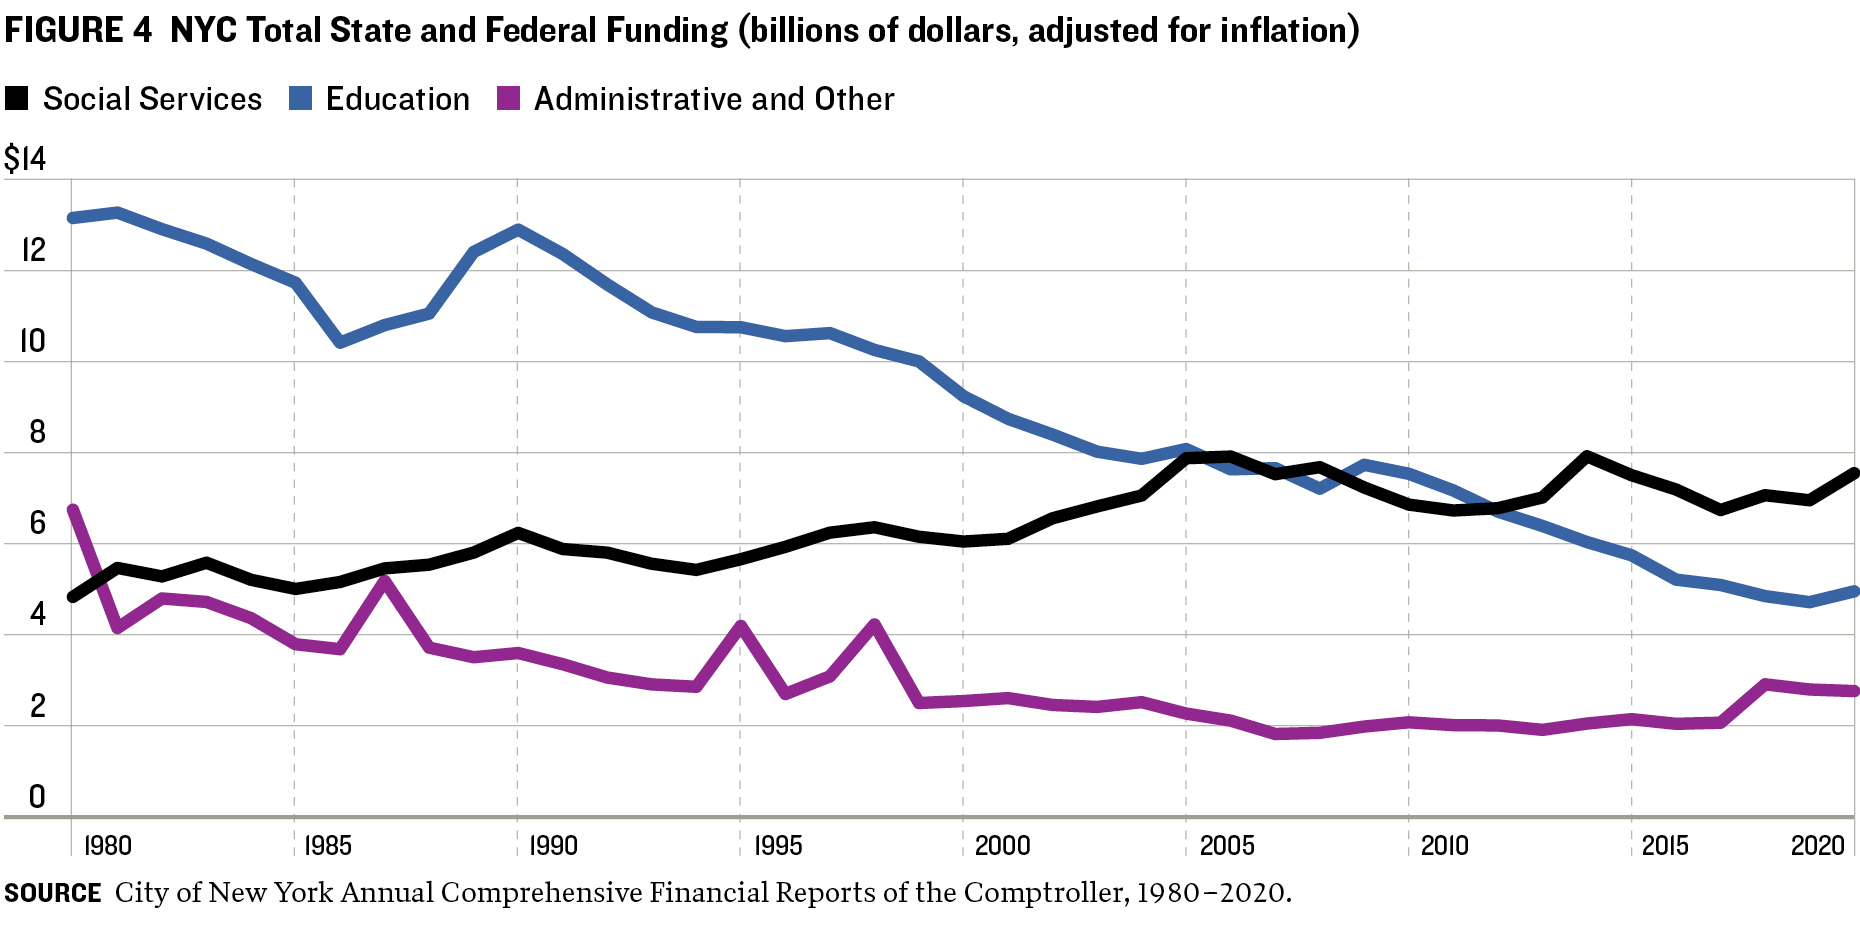
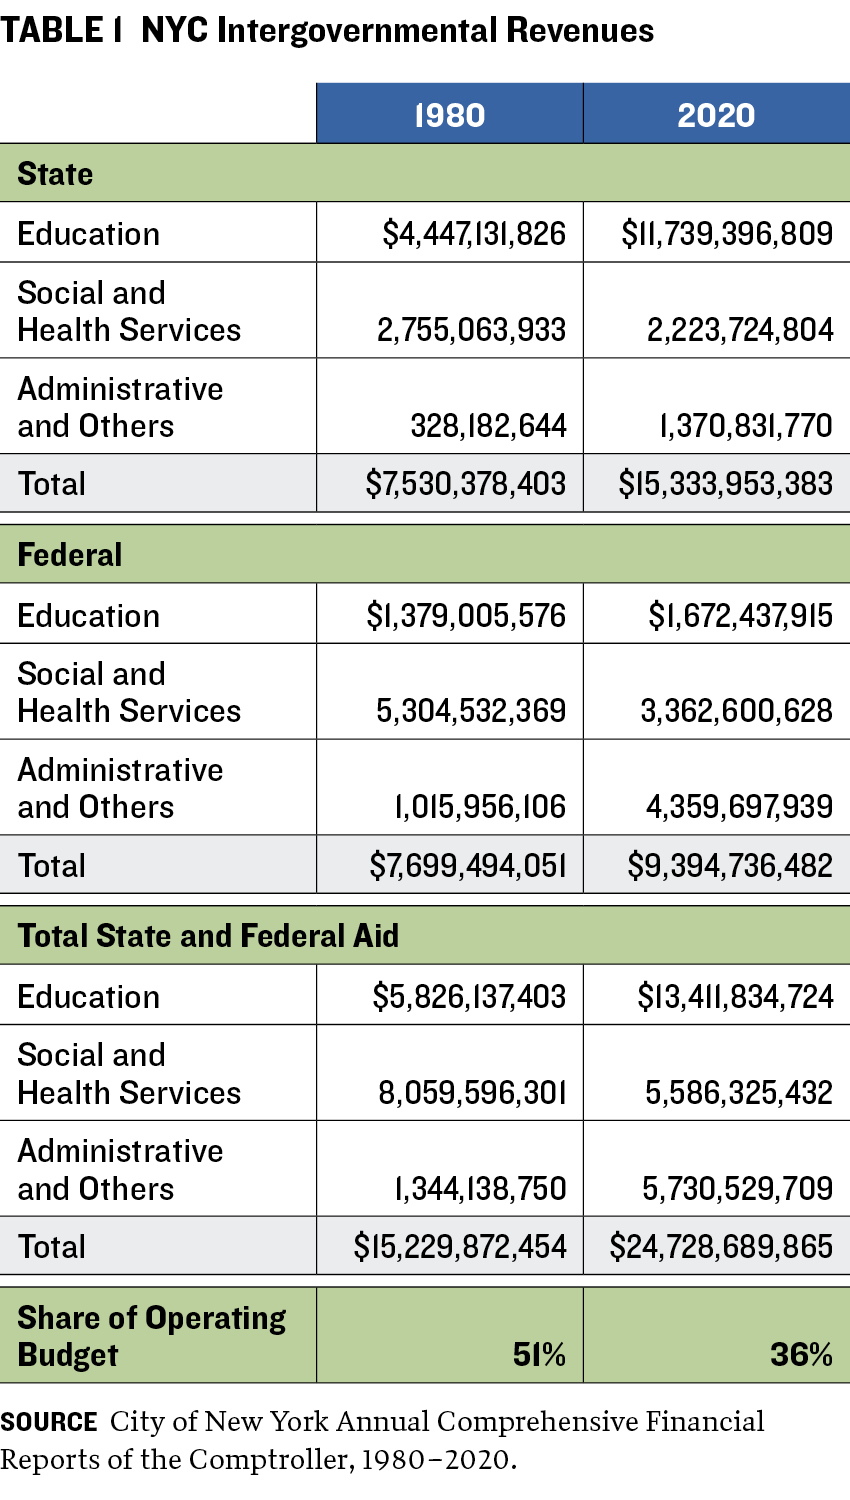
As shown in figure 4 and table 1, the two largest components of New York City’s budget financed by intergovernmental revenue are education and social services, principally Medicaid. These categories represent almost 73 percent of intergovernmental revenue outlays. The percentage is the lowest in decades, largely because of the expansion of education spending financed with municipal rather than intergovernmental dollars. Since 1980, these two intergovernmental revenue sources have accounted for over 90 percent of all transfers to the city.
The remaining significant sources of intergovernmental revenue include transportation, housing (largely public housing programs), higher education (primarily for City University of New York and community colleges), public safety, and health programs other than Medicaid. These services consumed less than 10 percent of intergovernmental revenue in 2020, although this is an increase over historical trends.
CASE STUDY: Education
NEW YORK CITY SPENT MORE THAN $29 billion on education in 2020, making this the largest single programmatic item in the budget. The city’s education system includes kindergarten through high school, or K-12, programs; it added universal pre-K, or preschool for 4-year-olds, in 2014 as well as 3–K, for 3-year-olds, in 2017. Like other education services, universal pre-K is funded with a combination of state and local money. The 3–K program has been funded largely with local money, although it was augmented with temporary federal funds related to the COVID-19 pandemic response.
Spending by the New York City Department of Education has increased on an inflation-adjusted basis from about $10.5 billion in 1980. In 2020, about 77 percent of all money from New York State to the city was devoted to education (excluding higher education), up from about 59 percent in 1980. State intergovernmental revenue for education has increased on an inflation-adjusted basis from less than $4.5 billion in 1980 to nearly $12 billion in 2020. This spending has risen significantly over the past several decades, including an increase in foundational aid to most school districts. However, New York City has increasingly added its own funds to education to finance programs, such as universal 3–K, that are policy choices of local elected officials.
As services covered by the education system have expanded, per pupil spending has also increased. In 1990, New York City spent about $20,500 per pupil; about 46 percent of that outlay came from city funds. By 2020, per pupil spending had topped $30,000; 58 percent of it came from the city. Adjusted for inflation, New York City’s spending per pupil rose to more than $17,000 in 2020 from about $9,400 in 1990; in the same period, intergovernmental revenue increased in real terms to about $12,000 from about $11,000. In other words, the significant increase in per pupil spending in New York City is largely being financed with city funding. Nevertheless, a large portion is still paid for by state and federal money.
City Department of Education spending on operations, which covers general and special education, rose nearly 60 percent in real terms between 1990 and 2020. At the same time, the agency’s debt service cost climbed from less than $300 million to almost $2.8 billion annually. The increase was fueled by expenditures financed largely with debt as part of the fiscal 2000–04 capital plan.6 Further, pension contributions for labor have ballooned from about $1 billion to almost $3.7 billion annually. The rise generally followed overall increases in pension costs for the city that resulted partly from recessions that negatively affected pension fund investments. If a fiscal shock interrupted future financial transfers from the state or federal governments (either in full or in part), New York City would be left to fill in the budgetary hole, at least temporarily, because education programming cannot be significantly shifted or swiftly altered. Debt service and pension costs, for example, would be difficult to pause, and the city would be obligated to cover these even if it were grappling with a shock.
 Given New York City’s reliance on federal and state funds, it lacks sufficient fiscal reserves to offset a drop in intergovernmental revenue that might stem from a sharp recession. The city was required to budget in accordance with generally accepted accounting principles (GAAP) after the 1975 fiscal crisis that left it minutes away from bankruptcy. But GAAP standards that expenditures in a given year be supported by revenues earned in the same period precluded the city from creating a rainy day fund. It was able to amass some savings by prepaying debt service or other obligations—such as other postemployment benefits (OPEB), principally retiree health care—in years when it posted budget surpluses.7 But the reserves were far less than needed and were depleted in recessions.
To address this policy shortcoming and allow an exception to GAAP budgeting requirements, city officials in 2021 established a formal rainy day fund, the Revenue Stabilization Fund, after the state legislature and municipal voters approved a city charter amendment.8 However, the $1.95 billion deposited into the fund by the end of fiscal 2022 represents only about 3 percent of total tax city tax revenue for that fiscal year—well below 10 percent-
16 percent of total municipal tax revenues recommended by the city comptroller.9
CASE STUDY: Medicaid and Other Social Services
BEFORE THE PANDEMIC, New York City's local share of Medicaid spending averaged around $5 billion annually out of total social services spending of $15 billion to $19 billion.10 Medicaid also receives significant funding from other levels of government in its budget. It was conceived as a national federal-state partnership to finance health insurance for low-income Americans, although recent modifications to the Affordable Care Act have increased the income thresholds to qualify for the program.11 Further, during the pandemic, the federal government increased funding for its share of Medicaid as long as states kept people enrolled in the program. In New York State, Medicaid enrollment grew from about 6.2 million before the pandemic to more than 7.1 million by 2021.12 By July 2022, 7.6 million New York State residents were enrolled in Medicaid.13
Financing for the Medicaid program is split between the federal government and state governments; since 1966, New York State’s Medicaid program has divided the nonfederal portion between state and local governments. As a result, New York City pays for 25 percent of its Medicaid program and receives the other 75 percent from the federal and state governments. Most other large US cities do not bear this much of the cost. More than $4.8 billion in intergovernmental revenue went to New York City for social services (primarily Medicaid) in 2020. The figure represented almost one-fifth of all intergovernmental revenue, down from one-half in 1980.
Intergovernmental revenue to New York City for social services has risen nominally, by an annual average of over 4 percent, from less than $2.2 billion in 1980. However, when adjusted for inflation, social service intergovernmental revenue has declined by about 2 percent per year on average between 1980 and 2020. Like education spending, social service spending is vulnerable to sudden reductions if a fiscal shock to New York State or the federal government were to delay or reduce intergovernmental transfers to New York City. In such a case, the city probably would be left to fully fund social service programs on its own, at least over the short term.14
NYC RELIES ON INTERGOVERNMENTAL REVENUE MORE THAN THE TEN NEXT-BIGGEST US CITIES
WHILE COMPARING BIG CITIES IS DIFFICULT because different municipalities finance different services through their operating budgets, the Lincoln Institute of Land Policy has compiled fiscal data that account for these inconsistencies across cities by combining city data with the finances of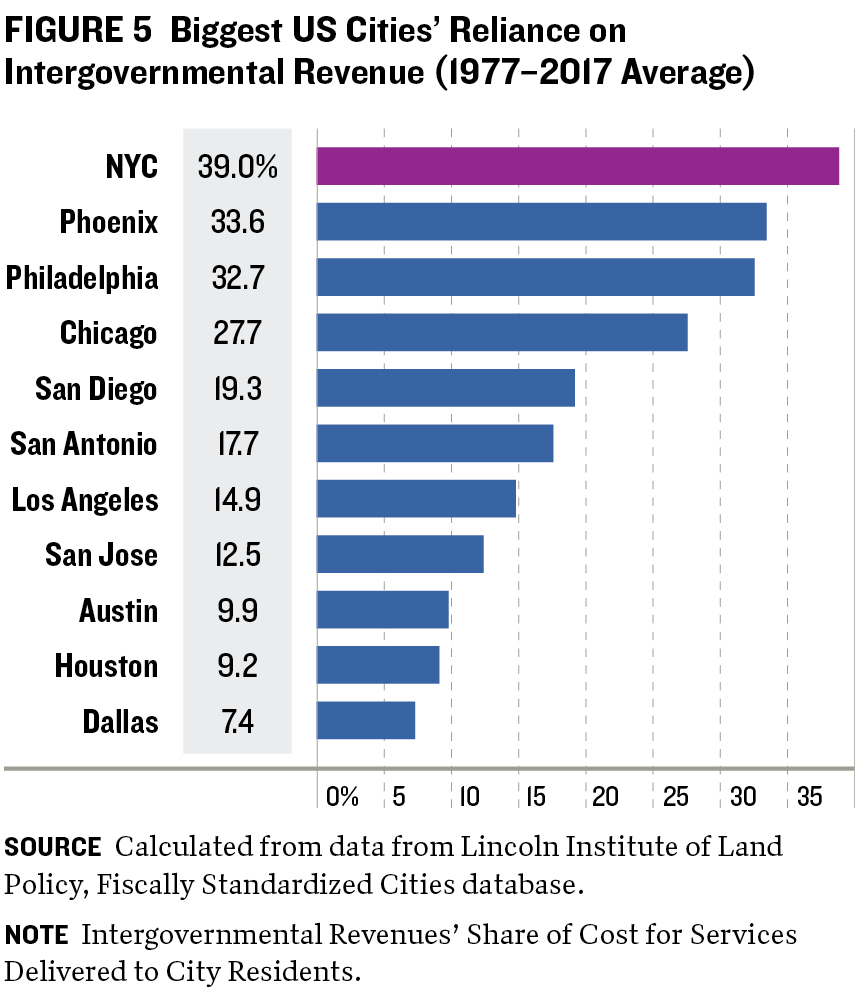 overlying districts, such as independent school districts, special districts, and counties.15 Controlling for such differences, New York City, which is made up of five counties and operates its own school, water, sewer, and hospital systems, remains an outlier when compared with the ten next-largest cities in the country (figure 5).
From 1977 to 2017, an average of 39 percent of New York City’s operating budget came from intergovernmental revenues. Phoenix ranked second, with intergovernmental revenue accounting for 34 percent to fund comparable public services; Dallas, at 7 percent, had the lowest percentage of intergovernmental revenue on average.16 New York City’s contribution for Medicaid is the most significant source of the difference.
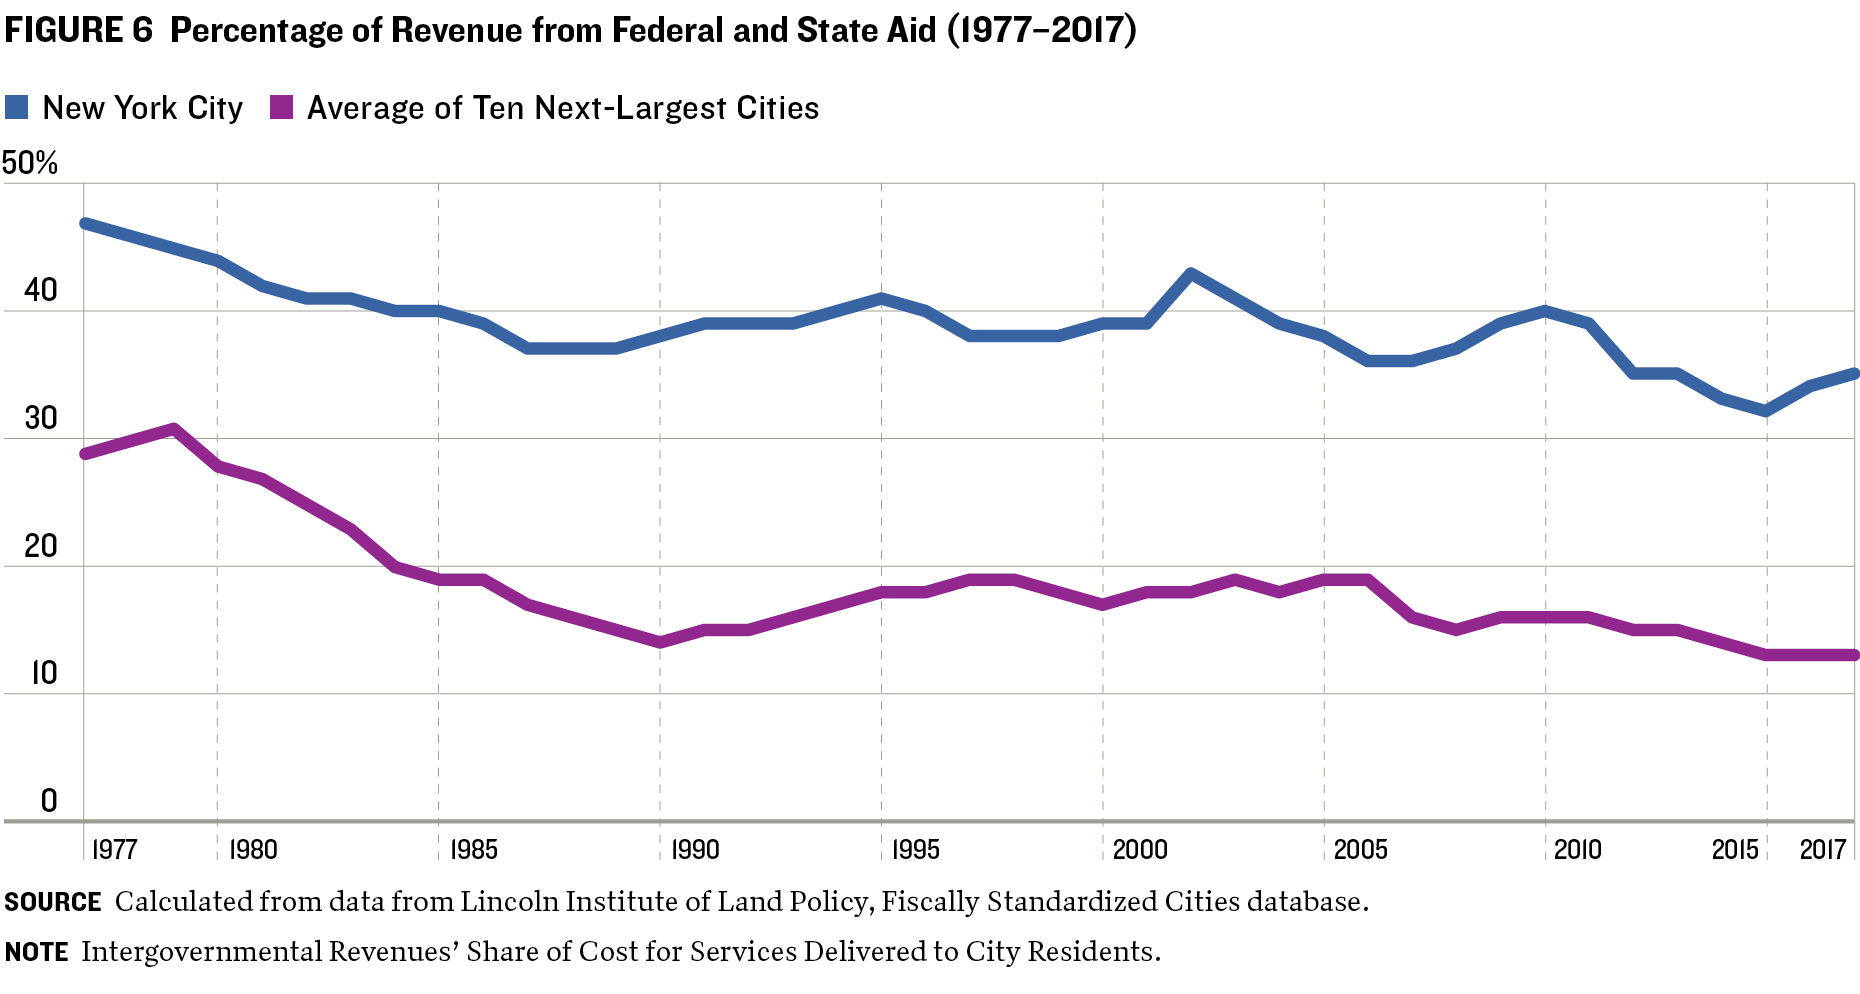
Figure 6 shows that New York City relies more on intergovernmental revenues than other large cities, even when accounting for differences in services provided.
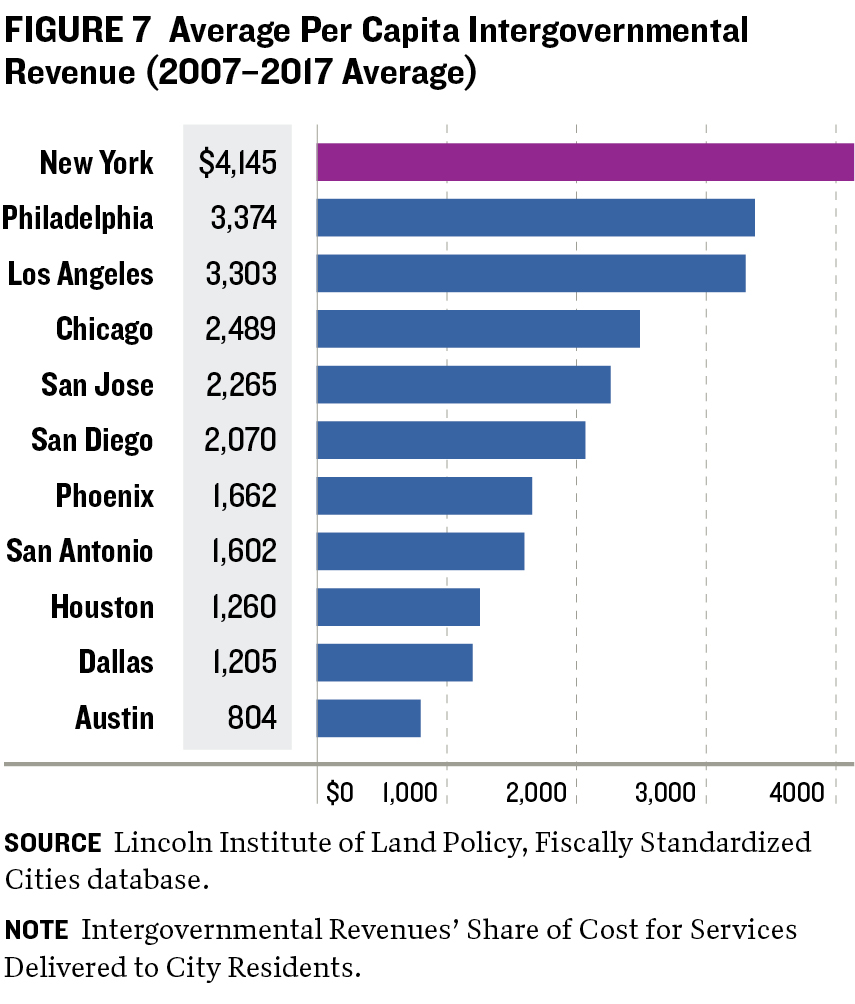
Another way to compare cities is by examining how much each resident receives in services that are paid for through intergovernmental transfers. Even adjusting for varying levels of service provision, New York City receives significantly more intergovernmental revenue per resident than other large US cities (figure 7). In 2017, for example, it received over one-third as much intergovernmental revenue per resident as Los Angeles, the next-largest municipality, and over 2.3 times as much as the average large US city. This was an increase from 2007, when New York City received 1.7 times as much intergovernmental revenue as the average large city. Increases in intergovernmental transfers for education and Medicare account for much of this trend.
FEDERAL COVID-19 RELIEF FUNDS POSE LONG-TERM BUDGET RISKS TO NYC
THE AMERICAN RESCUE PLAN ACT OF 2021 (ARPA) included significant support for state and local governments in general and targeted funding for K–12 education, housing, transportation, and public health. In total, New York City is expected to receive over $25 billion in federal aid from COVID-19 relief legislation from ARPA; the Coronavirus Aid, Relief, and Economic Security (CARES) Act; and the Federal Emergency Management Agency. The intent of these funds was to help governments manage fiscal shocks created by the COVID-19 pandemic. New York City budgeted about $3 billion of those funds for fiscal 2020, mostly from CARES Act financing, and $3.6 billion was budgeted for fiscal 2021; $15.7 billion was added for fiscal 2021–25 with the passage of ARPA.
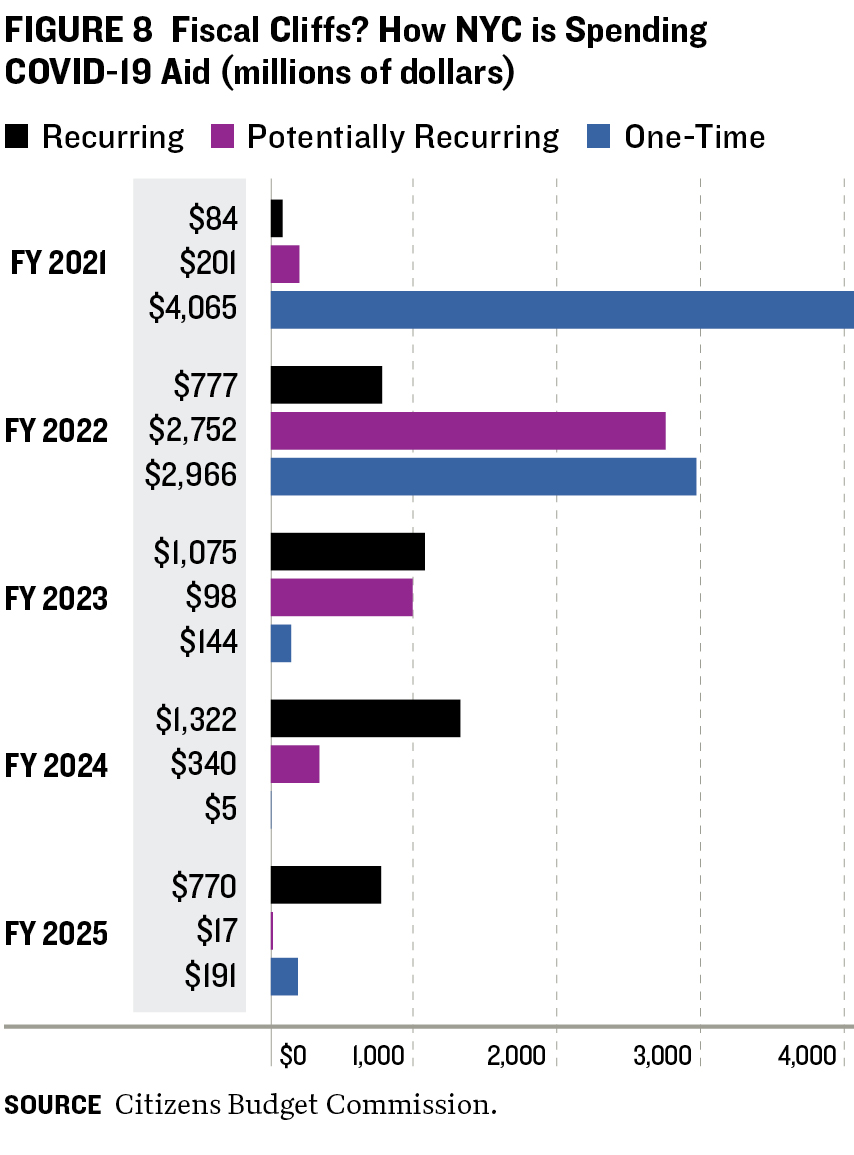
Recipients that use the one-time federal emergency aid to fund recurring operating costs rather than to cover one-time costs for infrastructure, worker bonuses, or replacement of lost revenues do so at great risk. New York City’s fiscal 2023 budget included spending of about $2.2 billion paid for with federal aid, plus nearly $1.6 billion for fiscal 2024 and about $1 billion for fiscal 2025, after which the funds will be exhausted.17 It will require significant political capital to reduce future spending on programs started or bolstered by federal aid when the revenue is scheduled to end, on December 31, 2026. For example, New York City used more than $566 million in that aid to replace city funding of personnel and paid leave for the police department in fiscal 2022. The department did not reduce its spending in any meaningful way; head count remained flat, and no significant reductions in other expenditures were planned.18 This money will either have to be replaced by own-source revenue in subsequent fiscal years or the department’s budget will have to be cut substantially.
The use of COVID-19 aid for recurring spending in New York City has resulted in a fiscal cliff of at least $1 billion (figure 8).19 Mayor Eric Adams’s November 2022 financial plan projects budget gaps of nearly $6 billion annually by fiscal 2026. Making matters worse, recurring spending in New York City grows faster than the revenues that support it, which generates sizable structural deficits.
Beyond the expiration of COVID-19 relief aid, with the persistence of remote work practices following the pandemic, New York City faces the possibility of a significant reduction in the value of commercial real estate, which is expected to drive down property tax revenues and tighten future budgets.20 That means New York City is unlikely to generate revenue on its own to substitute for the expiring aid. Failure to address the funding of permanent spending with temporary funds will only increase projected budget gaps.
 Education programs currently financed with temporary federal aid include 3–K expansion,21 preschool special education, mental health programs for public schools, school arts programs, school athletics, funds for addressing student learning loss during the pandemic, and other instructional supports such as student tutoring. Noneducation programs currently financed with temporary federal aid include enhanced payments to nonprofits (which are among the service providers tasked with homeless outreach and child welfare), mobile mental health interventions, housing court assistance for tenants, and rental assistance vouchers. These are critical services. It is unlikely that the city will be able to suspend these programs or revert spending to fiscal 2020 levels after program recipients and administering agencies have become accustomed to expanded resources for nearly four years.
New York City has also benefited from increased federal payments for Medicaid costs that were included as part of the CARES Act. In March 2020, the federal government increased its share of Medicaid payments by 10 percentage points in response to the pandemic and covered the entire cost of vaccine administration to Medicaid recipients. During the pandemic, the number of Medicaid recipients in the city jumped 25 percent. About 3.4 million city residents had been enrolled in Medicaid before the pandemic, and the number had risen to more than 4.2 million by August 2022.22 As a result, even with higher Medicaid caseloads, the city saved nearly $1 billion in program costs.23 The end of the COVID-19 public health emergency on May 11, 2023, brings to an end the increased federal share of Medicaid payments.24 New York City will be saddled with a greater percentage of the cost and the continued responsibility to serve an expanded population of Medicaid enrollees, assuming the city does not remove these new populations from its Medicaid rolls. Further, because Medicaid is not administered by the city, leaders will have little agency to reduce benefits or associated costs.
RISK TO NYC FROM RELIANCE ON STATE FUNDS
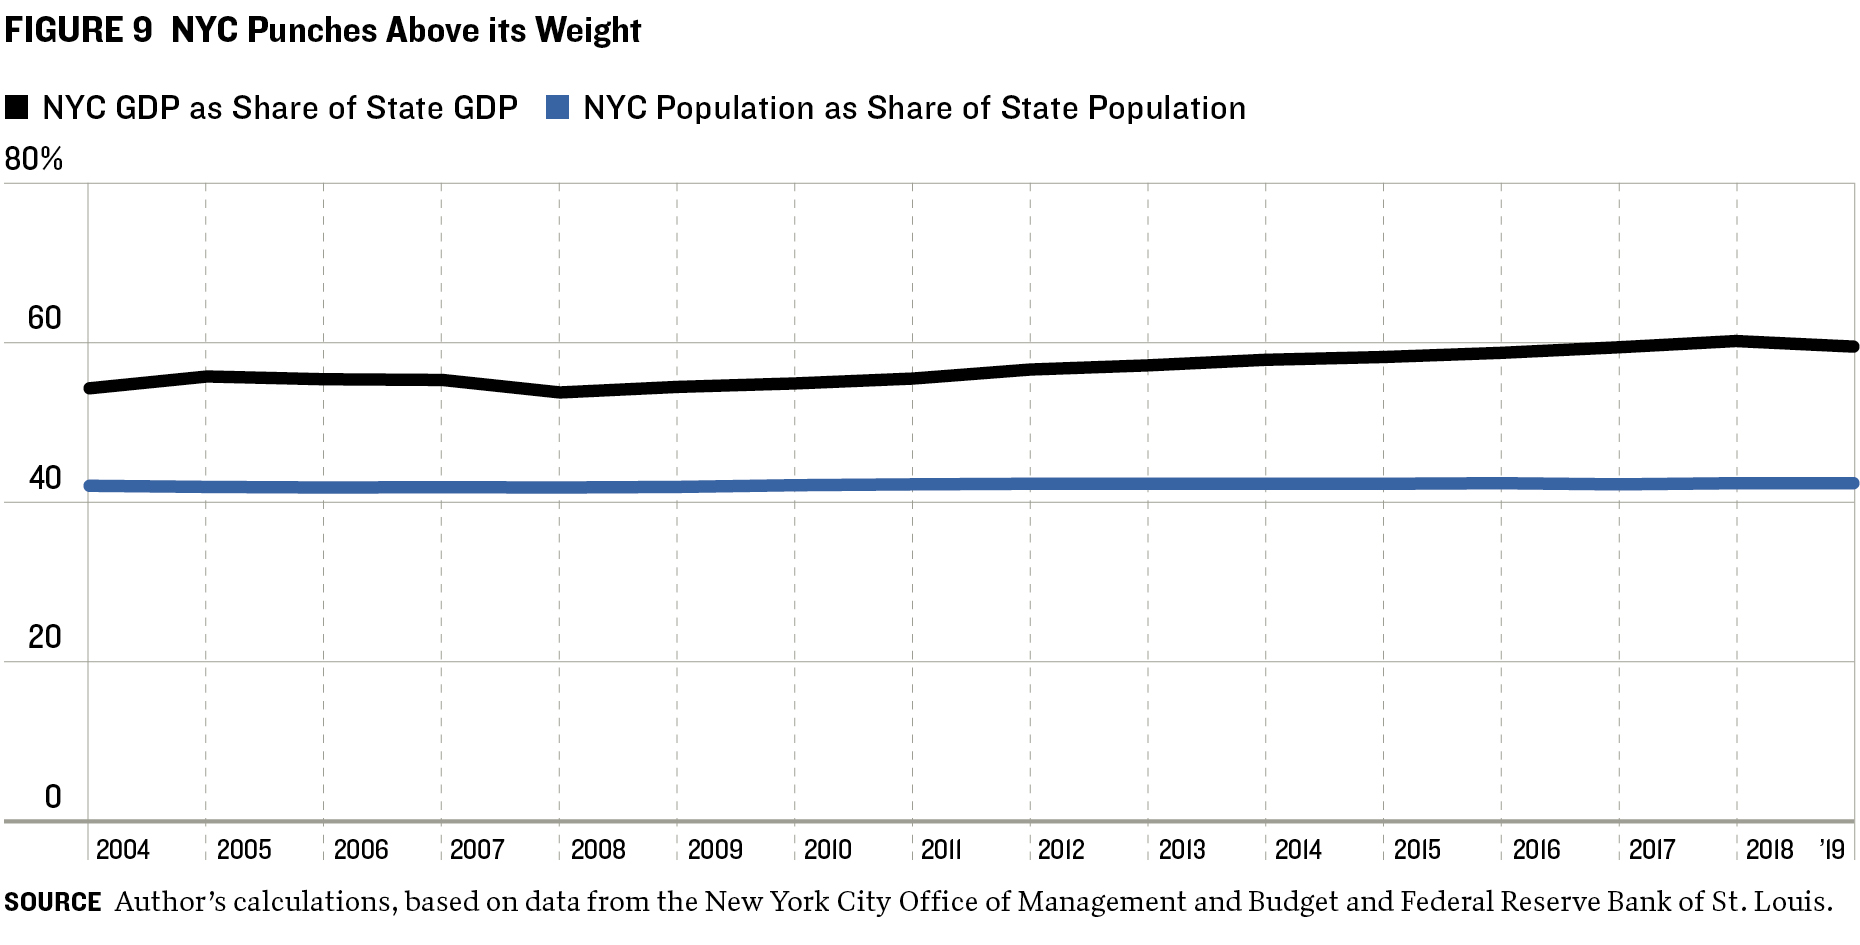
IN ADDITION TO FACING A LOSS in federal pandemic budgetary aid, New York City faces a loss of revenue from New York State if the economy falters. The city accounts for about 42 percent of the state’s population and 60 percent of its economic output (figure 9), and much of the tax revenue it sends to the state is recycled back into municipal coffers.25 This reflects New York City residents earning 10 percent more personal income per capita than the state average.26 The city’s average figure understates the extremely high income of the top-percentile earners living in Manhattan and employed in banking, law, and other professions.
New York City relies upon these extremely high-income taxpayers for a significant portion of its budget. In 2019, for instance, the top 1 percent of tax filers in the city (fewer than 40,000 filers) accounted for over 41 percent of personal income tax liability.27 The same high-income filers generate a significant portion of New York State’s budget; in 2019, the top 1 percent of state filers accounted for over 42 percent of personal income tax liability.28 Were even a small number of these filers to flee the city and move out of state, the budgetary effects could be significant for both.
In 2018, income for the top 1 percent of New York City filers included 84 percent of all the realized capital gains earned there, 70 percent of all dividend and interest income, and 68 percent of all business income.29 These income sources are highly cyclical and dependent on the overall economy—and particularly on the fortunes of Wall Street.
The financial crash of 2007–08 that helped spawn the Great Recession demonstrated the top 1 percent of taxpayers’ importance to the city’s budget. Personal income tax collections in New York City plunged 23 percent from fiscal 2008 to 2009, reducing income tax revenue by more than $2.2 billion. While the income of the bottom 99 percent of tax filers slipped less than 5 percent in this period, incomes of the top 1 percent of filers fell nearly 22 percent.30
New York City is constrained from raising taxes to make up for declines in intergovernmental revenue. City residents—especially its highest-income earners—already face some of the nation’s steepest personal income tax rates. In 2022, New York State’s top income tax rate was 10.9 percent, and the city’s top rate (which is subject to state approval) was 3.9 percent. The combined rate of 14.8 percent exceed that of California, which at 13.3 percent has the highest personal income tax of any state. The high combined top tax rates may prompt some high earners to migrate to states with low or no income taxes.
Another concern for New York City is that its economic prospects are largely intertwined with public authorities that it does not directly control. The Metropolitan Transportation Authority (MTA) runs and finances the city’s subway as well as important bridges, tunnels, and commuter rail lines that the local economy depends upon. Similarly, the Port Authority of New York and New Jersey, an independent bistate agency, operates and finances local airports, a commuter rail line, and ports. These agencies are instrumental to New York City’s own-source revenue generation because of the economic activity they generate.
The risk is that a financial crisis in one of the debt-burdened authorities might require New York City to provide financial assistance to protect its own tax base. The MTA has $34 billion of debt outstanding and is seen as too big to fail because New York City cannot function without a robust public transportation system.31 The Port Authority had outstanding debt of $29 billion, backed by tolls, fees, and rental income, at the end of 2021.
CONCLUSION AND RECOMMENDATIONS: Positioning NYC for Long-Term Fiscal Health
INTERGOVERNMENTAL REVENUES from federal and state sources are vital to helping New York City deliver a remarkable menu of public services to its almost 8.5 million residents. The city should use the opportunity presented by COVID-19 relief money to strengthen the structural integrity of its budget to prepare it to weather economic downturns, natural disasters, and other events that may affect its long-term fiscal health. We recommend the following actions to cut the risks associated with reliance on intergovernmental revenue and strengthen the long-term sustainability of the budget.
- Maintain long-term structural fiscal balance. New York City should pursue long-term fiscal balance through a combination of expenditure controls, revenue increases, and budgetary savings to be used in hard times.
- Increase the size of the Revenue Stabilization Fund. Rainy day fund reserves buy governments time to make long-term decisions that are structurally sound and help avoid budget maneuvers such as using debt and other one-time resources to pay for continuing expenditures—actions that precipitated the city’s near-bankruptcy in 1975.
- Prioritize rainy day fund deposits. Now that New York City is permitted to have a rainy day fund, less desirable fiscal practices become unnecessary. Previously, the city has used debt prepayment and its OPEB Trust together as a de facto rainy day fund, increasing payments to the trust when budget surpluses occurred and decreasing contributions amid deficits. Now, OPEB should be funded systematically to reduce accumulated unfunded liability of benefits rather than used as a substitute for a rainy day fund. Such a change would also benefit the operating budget in the long term by reducing the required annual payment as the unfunded liability declines.
- Adopt strict rules for rainy day fund withdrawals and deposits. To position New York City for long-term fiscal health, city leaders should adopt sound management practices around the use and replenishment of the rainy day fund. The Volcker Alliance has recommended the following best practices for state rainy day funds32 that could be adapted for use by New York City:
- Allow fund withdrawals only when certain conditions set by rules are met.
- Limit the amount of withdrawals in any single fiscal year.
- Require extraordinary action (such as a supermajority vote) to tap funds for reasons beyond an economic emergency or natural disaster.
- Require a policy for how the rainy day fund is replenished once it is used.
- Identify revenue sources for the rainy day fund. For example, one-time revenue windfalls can be saved rather than used to cover recurring expenditures that will need another revenue source once the windfall is spent.
- Require repayment of the fund after use and when certain conditions are met.
- Require the city to deposit annual surpluses into the Revenue Stabilization Fund.
- Make revenue volatility—especially in intergovernmental aid—a guide to how large the fund should be.
ACKNOWLEDGMENTS
THIS REPORT WAS MADE POSSIBLE in part by a grant from the Peter G. Peterson Foundation. The statements made and views expressed are solely the responsibility of the author. We acknowledge the considerable support provided by the late Paul A. Volcker, the Volcker Alliance’s founding chairman, as well as the numerous academics, government officials, and public finance professionals who have guided the Alliance’s research on state budgets for the last seven years.
ENDNOTES
- City of New York, February 2022 Financial Plan Detail, 3, https://www.nyc.gov/assets/omb/downloads/pdf/tech2-22.pdf.
- General Accounting Office, Federal-State-Local Fiscal Relations: Report to the President and the Congress, 1985, https://books.google.com/books?id=XyjRW0jv2AAC&printsec=frontcover&sour…;
- John Mikesell, Fiscal Administration: Analysis and Applications for the Public Sector, 5th ed. (Fort Worth, Texas: Harcourt Press, 1998).
- Office of the New York State Comptroller, New York’s Economy and Finance in the COVID-19 Era, July 22, 2020, https://www.osc.state.ny.us/reports/covid-19-july-22-2020.
- Richard Briffault, “The Power of the Mayor: A Legal Framework,” October 2021, NYC 2025, New York University, https://wagner.nyu.edu/nyc2025/policy-proposals.
- Independent Budget Office, Analysis of the Mayor’s Executive Budget for 2000, May 15, 1999, https://ibo.nyc.ny.us/iboreports/mayrepfisc2000/mayreportfy2000.html. From 2000 to 2004, $6.9 billion of capital spending was dedicated to education. Of this amount, nearly 97 percent came from the city and the remainder from the state and federal government. Of the $6.6 billion of city funds, $6.4 billion was derived from issuing bonds. See also Independent Budget Office, Follow the Money: Were School Construction Dollars Spent as Planned?, September 2005, https://www.ibo.nyc.ny.us/iboreports/edcapital_fbsept2005.pdf.
- OPEB is a collection of benefits that the city promises to current employees and provides to most current retirees. It includes health insurance for those not yet eligible for Medicare, payments for Medicare supplements for those eligible for Medicare, and prescription drug and vision benefits, among others. Unlike pension benefits, OPEB was not prefunded for most of its history, so the trust contains only a small fraction of the assets needed to pay for these promised benefits.
- Office of the New York State Comptroller’s Office, “DiNapoli Urges NYC to Shore Up Rainy-Day Fund,” press release, Nov. 10, 2021, https://www.osc.state.ny.us/press/releases/2021/11/dinapoli-urges-nyc-s…;
- Office of the New York City Comptroller, “NYC Comptroller Brad Lander Proposes Formula for Annual Deposits into City’s ‘Rainy Day Fund,’ Requiring Additional $1.8 Billion in Reserves This Year,” press release, May 23, 2022, https://comptroller.nyc.gov/newsroom/nyc-comptroller-brad-lander-propos…;
- Citizens Budget Commission, Still a Poor Way to Pay for Medicaid, Oct. 1, 2018, https://cbcny.org/research/still-poor-way-pay-medicaid.
- In New York State, nonelderly adults with incomes at or below 138 percent of the poverty level qualify for Medicaid.
- The federal government increased its share of funding by 6.2 percentage points during the declared public health emergency. Office of the New York State Comptroller, Medicaid: Enrollment Growth, COVID-19 and the Future, December 2021, https://www.osc.state.ny.us/files/reports/pdf/medicaid-enrollment-growt…;
- United Hospital Fund Medicaid Institute, New York Medicaid Enrollment, accessed May 2, 2023, https://uhfnyc.org/our-work/initiatives/medicaid-institute/dashboards/m…;
- David Friedfel and Patrick Orecki, Overdue Bills: Time to Face the Reality of Rising Medicaid Costs, Oct. 9, 2019, https://cbcny.org/research/overdue-bills. For three years (2017–19), New York State delayed Medicaid payments from February to March in order to move the expenditures into different fiscal years. In 2019, this deferral amounted to $1.7 billion. New York State had not fully budgeted for Medicaid costs for several years before the 2020 COVID-19 pandemic, making longer deferrals an increasingly likely possibility.
- The data are explained fully at https://www.lincolninst.edu/research-data/data-toolkits/fiscally-standa…;
- For fiscal 2022, Arizona enacted significant tax reform that will affect local own-source as well as intergovernmental revenues and likely decrease the future share of revenues derived from intergovernmental sources for Phoenix.
- New York City Independent Budget Office, Federal COVID Relief Spending, accessed Nov. 1, 2022, https://ibo.nyc.ny.us/FedStim/stimulus-tracking-city.html.
- Patrick Ronk and Ana Champeny, “Six Fast Facts about the NYPD’s Preliminary FY2023 Budget,” Citizens Budget Commission, March 18, 2022, https://cbcny.org/research/six-fast-facts-about-nypds-preliminary-fy202…;
- “Testimony on NYC’s Spending of Federal COVID-19 Relief Funds,” submitted to the New York City Council Committee on Finance and Committee on Oversight and Investigations by Ana Champeny, vice president for research, Citizens Budget Commission, Nov. 7, 2022, https://cbcny.org/advocacy/testimony-nycs-spending-federal-covid-19-rel…;
- One estimate is that this could cost the city budget $600 million in 2023 alone. William Glasgall and Richard Ravitch, “NYC is Teetering on the Edge of Fiscal Cliffs,” New York Daily News, Sept. 9, 2022, https://www.nydailynews.com/opinion/ny-oped-nyc-fiscal-cliffs-20220909-…;
- 3–K is full-day early childhood education that is paid for by the city of New York for all eligible children.
- United Hospital Fund Medicaid Institute, New York Medicaid Enrollment, accessed May 2, 2023, https://uhfnyc.org/our-work/initiatives/medicaid-institute/dashboards/m…;
- Melinda Elias, “NYC Medicaid Enrollment and Claims Grow During Pandemic, But Feds Shoulder Cost Increase (For Now),” March 2022, Independent Budget Office, https://ibo.nyc.ny.us/iboreports/nyc-medicaid-enrollment-and-claims-gro…;
- US Department of Health and Human Services, “Fact Sheet: COVID-19 Public Health Emergency Transition Roadmap,” press release, Feb. 9, 2023, https://www.hhs.gov/about/news/2023/02/09/fact-sheet-covid-19-public-he…;
- Gross city product data from the New York City Office of Management and Budget, Quarterly Report on Economic Conditions, December 2021; gross state product data from Economic Research Division of Federal Reserve Bank of St. Louis, Gross Domestic Product: All Industry Total.
- Baruch College Zicklin School of Business, “Income and Taxes, New York City (NYC) Per Capita Income,” https://www.baruch.cuny.edu/nycdata/income-taxes/per_cap.htm.
- Author's calculations based on data and analysis by the New York City Independent Budget Office, Major Components of Adjusted Gross Income, Tax Year 2019, Tax Year 2019, https://www.ibo.nyc.ny.us/RevenueSpending/december2019pitdata.xlsx.
- New York State Department of Taxation and Finance, Percentile Distributions of NYAGI and Tax Liability for Full-Year Residents, https://www.tax.ny.gov/research/stats/statistics/pit-filers-summary-dat…;
- New York City Independent Budget Office, Major Components of Adjusted Gross Income, Tax Year 2019, https://www.ibo.nyc.ny.us/RevenueSpending/december2019pitdata.xlsx.
- Author’s calculations using data from New York City Independent Budget Office, Major Components of Adjusted Gross Income, https://ibo.nyc.ny.us/fiscalhistory.html.
- Matt Fabian and Lisa Washburn, New York: State of Debt, January 2022, the Volcker Alliance, https://www.volckeralliance.org/resources/new-york-state-debt.
- Katherine Barrett and Richard Greene, Rainy Day Fund Strategies: A Call to Action, July 2019, the Volcker Alliance, https://www.volckeralliance.org/resources/rainy-day-fund-strategies-cal…;
© 2023 VOLCKER ALLIANCE INC.
Published May, 2023
The Volcker Alliance Inc. hereby grants a worldwide, royalty-free, non-sublicensable, non-exclusive license to download and distribute the Volcker Alliance paper titled Revenue at Risk: Long-Term Strategies to Bolster NYC's Budget Against Potential Cuts in US and State Aid (the “Paper”) for non-commercial purposes only, provided that the Paper’s copyright notice and this legend are included on all copies.
This paper was published by the Volcker Alliance as part of its Truth and Integrity in Government Finance Initiative. The views expressed in this paper are those of the authors and do not necessarily reflect the position of the Volcker Alliance. Any errors or omissions are the responsibility of the authors.
Don Besom, art director; Michele Arboit, copy editor; Stephen Kleege, editor.
