
Strategies to Sustain Fiscal Health
EXECUTIVE SUMMARY
WITH THEIR REVENUES AND CASH RESERVES at record highs after unprecedented federal aid to offset the impact of COVID-19 on the US economy, states have embarked on the biggest wave of tax cuts in decades, slashing levies by at least $124 billion1 on everything from personal income to groceries and gasoline. Thirty-nine states enacted ninety-two substantial tax relief measures in fiscal years 2021–22. Additional cuts were implemented in 2023, even though revenues had slowed as pandemic-related federal assistance tapered off. With the impact of the tax relief likely to stretch well into the current decade, states risk budgetary shortfalls and reductions in critical public services if revenues shrink by more than anticipated in future years.
In this paper, we focus primarily on the two largest tax-relief categories—income and sales levies—which make up three-quarters of all state tax revenues. We include an appendix containing a State Tax Policy Tool Kit that provides resources for policymakers, municipal market investors, and citizens, as well as a set of case studies of tax reductions in several states. And to help policymakers avoid fiscal challenges stemming from recent tax changes, we present a series of recommendations for short- and longer-term policy changes. They include
• implementing tax policy changes that are temporary and require reevaluation;
• incorporating well-designed revenue trigger mechanisms to ensure that tax reductions are fiscally sustainable;
• prioritizing refundable tax credits to provide targeted and more affordable relief measures for those most impacted by the pandemic; and
• considering medium- and long-term fiscal scenarios to help gauge the risks of policy changes.
INTRODUCTION
AT THE START OF 2020, an unprecedented $4.6 trillion2 in federal relief to offset the impact of the COVID-19 crisis began to flow into state coffers—either directly or through income, sales, and other tax revenue generated by aid to businesses and consumers. Accordingly, states went from fearing another Great Recession at the onset of the pandemic to having record budget surpluses as it receded.
Dozens of states passed this windfall along to residents through one-time tax breaks or lowered tax rates that, measured in nominal dollars, marked the largest net reduction since at least 1979, according to the National Association of State Budget Officers (NASBO).3 The cuts will reduce state revenues by an estimated $124 billion through 2028,4 about equivalent to the amount states spend annually on highways.5 And while tax reductions helped states and localities recover from the pandemic’s economic impact, such strategies risk creating long-term budgetary shortfalls and reductions in critical public services if the economy slows and overall tax revenues shrink.
In this paper, we examine the tax reductions—as well as the few increases—states have enacted. The full impact of the recent changes in tax policy, especially reductions, is yet to be determined. But while one-time payments like tax rebates are easily accounted for, the longer-term effects of broad, permanent cuts may create future revenue shortfalls and put states closer to a fiscal cliff as they approach the 2026 expiration of $195.3 billion in federal aid as part of the Coronavirus State and Local Fiscal Recovery Funds (SLFRF) authorized under the American Rescue Plan Act.6
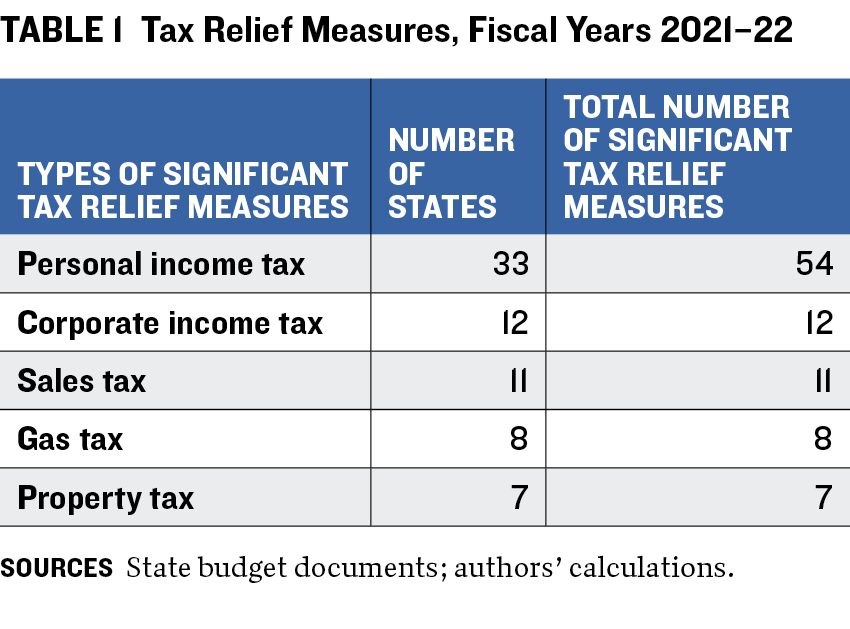 Table 1 presents a summary of major tax relief measures enacted recently. Over the fiscal years 2021–22, thirty-three states enacted fifty-four significant measures to cut personal income taxes. Twelve states reduced corporate income taxes, and eleven reduced sales taxes. And with fuel prices nearing record highs in 2022, five states suspended gasoline taxes, and three delayed increases to offset rising prices at the pump. With the pandemic fueling a boom in housing prices as employees fled cities and chose to work from their new homes, seven states offered property tax relief as real estate valuations soared.
MORE CUTS
Tax Relief Measures in FY 2023
SINCE THE END OF THIS REPORT’S study period, states have continued to pass tax relief measures despite slowing revenue growth, with at least twenty-six states enacting one or more measures in fiscal 2023. Kentucky passed gasoline tax legislation, Indiana and New Hampshire enacted property tax reforms, and states across the country lowered personal and corporate income taxes.
HOW STATES ARE PROVIDING TAX RELIEF
STATES HAVE PURSUED A WIDE ARRAY of policy changes in the pandemic era, and tax relief is one of the most prominent. The reductions have been driven by higher-than-expected growth in tax revenues and record amounts of federal aid, resulting in unprecedented fiscal reserves. Tax relief measures have ranged from permanent and broad-based rate reductions to targeted credits and temporary rebates. Thirty-nine states adopted ninety-two significant tax cuts during fiscal years 2021–22, the principal focus of this study, although they continued in subsequent periods (box above). The first round of cuts, in 2021, centered on personal and corporate income levies. Measures in 2022 were more ambitious and included actions affecting sales, property, and motor fuel taxes on top of additional personal and corporate income tax cuts.
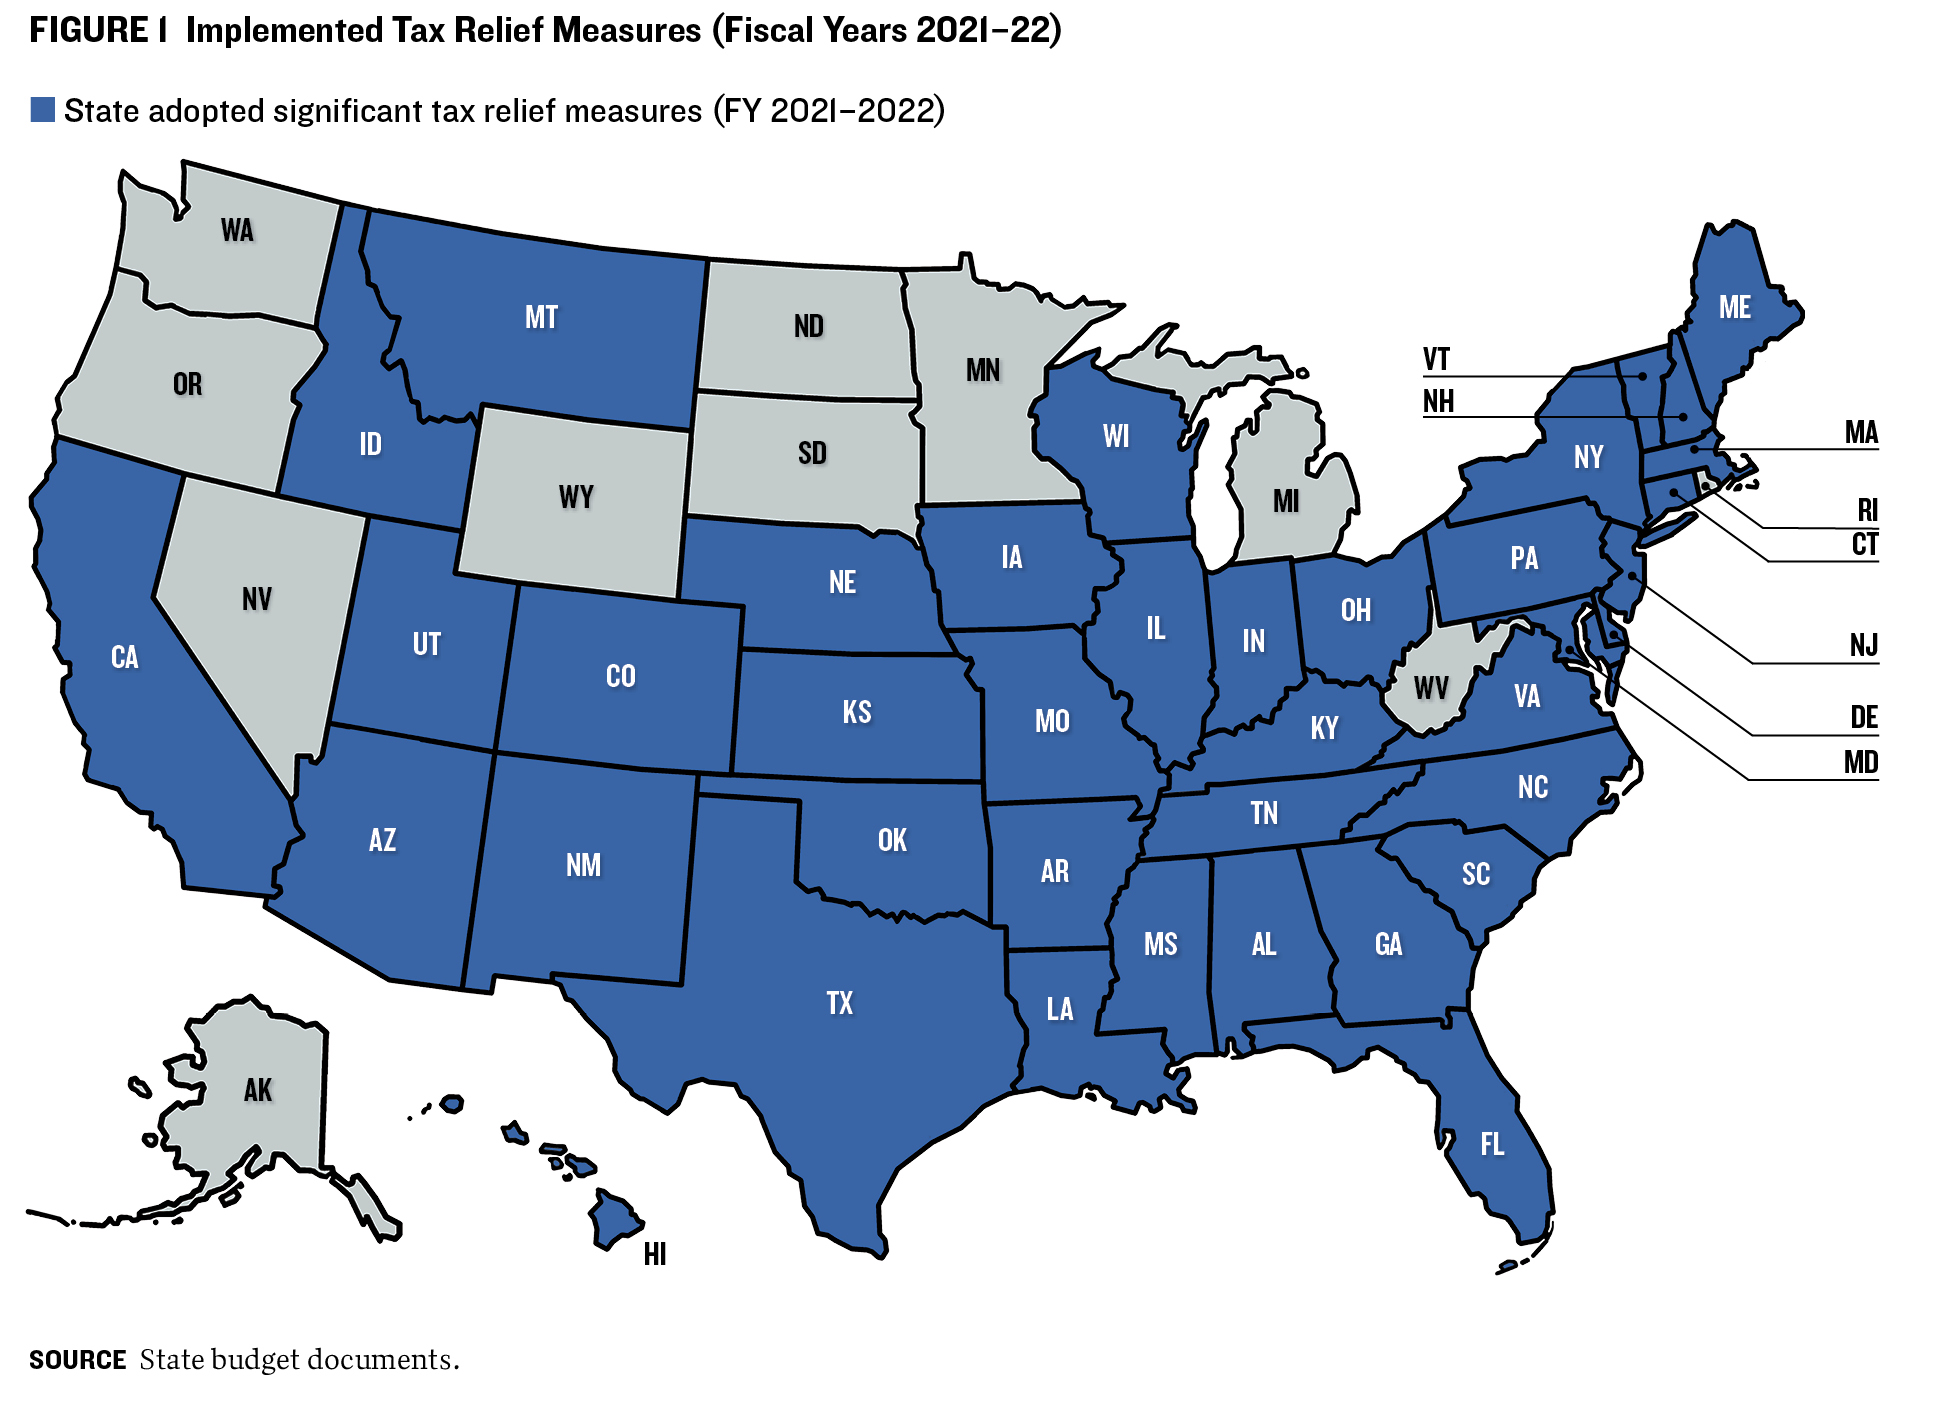
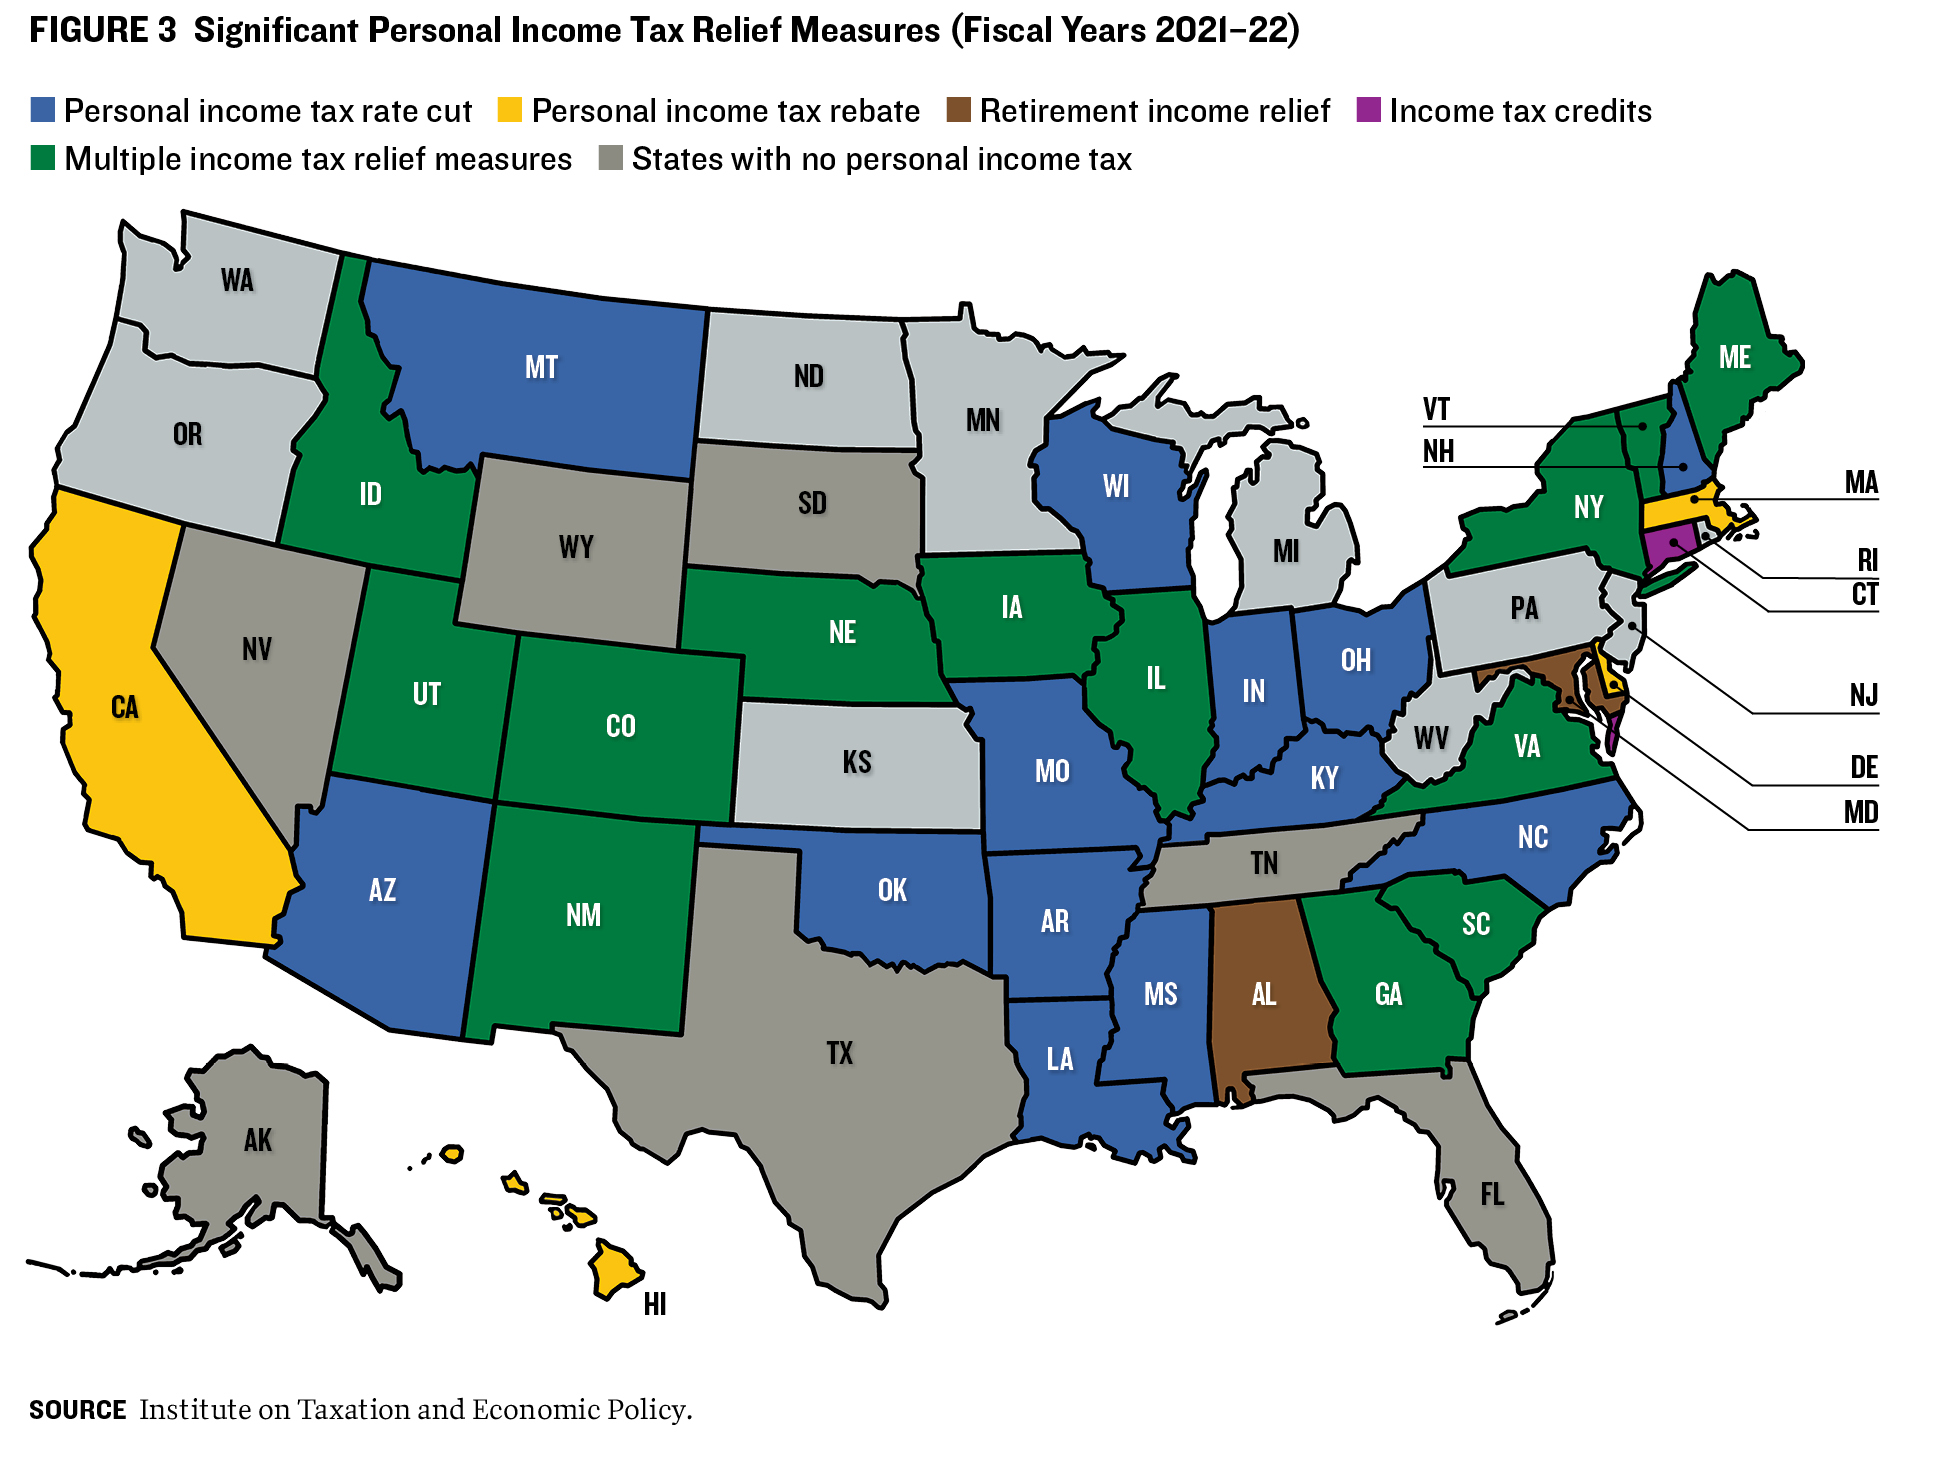
As detailed in table 1, relief measures focused on personal income taxes, followed by corporate income taxes and sales and motor fuel taxes. Figure 1 shows the geographic spread of these major relief measures. The few states that did not enact significant tax relief measures are mostly in the Midwest and Pacific Northwest. In addition to enacting significant reductions, states lowered a variety of lesser levies in categories including meals and hotel rooms (New Hampshire) and inheritances (Iowa). Tennessee eliminated taxes on dividends and income.
Tax Triggers
Some states have enacted so-called tax triggers, which require implementing tax policy changes contingent on meeting preestablished revenue targets (figure 2).7,8
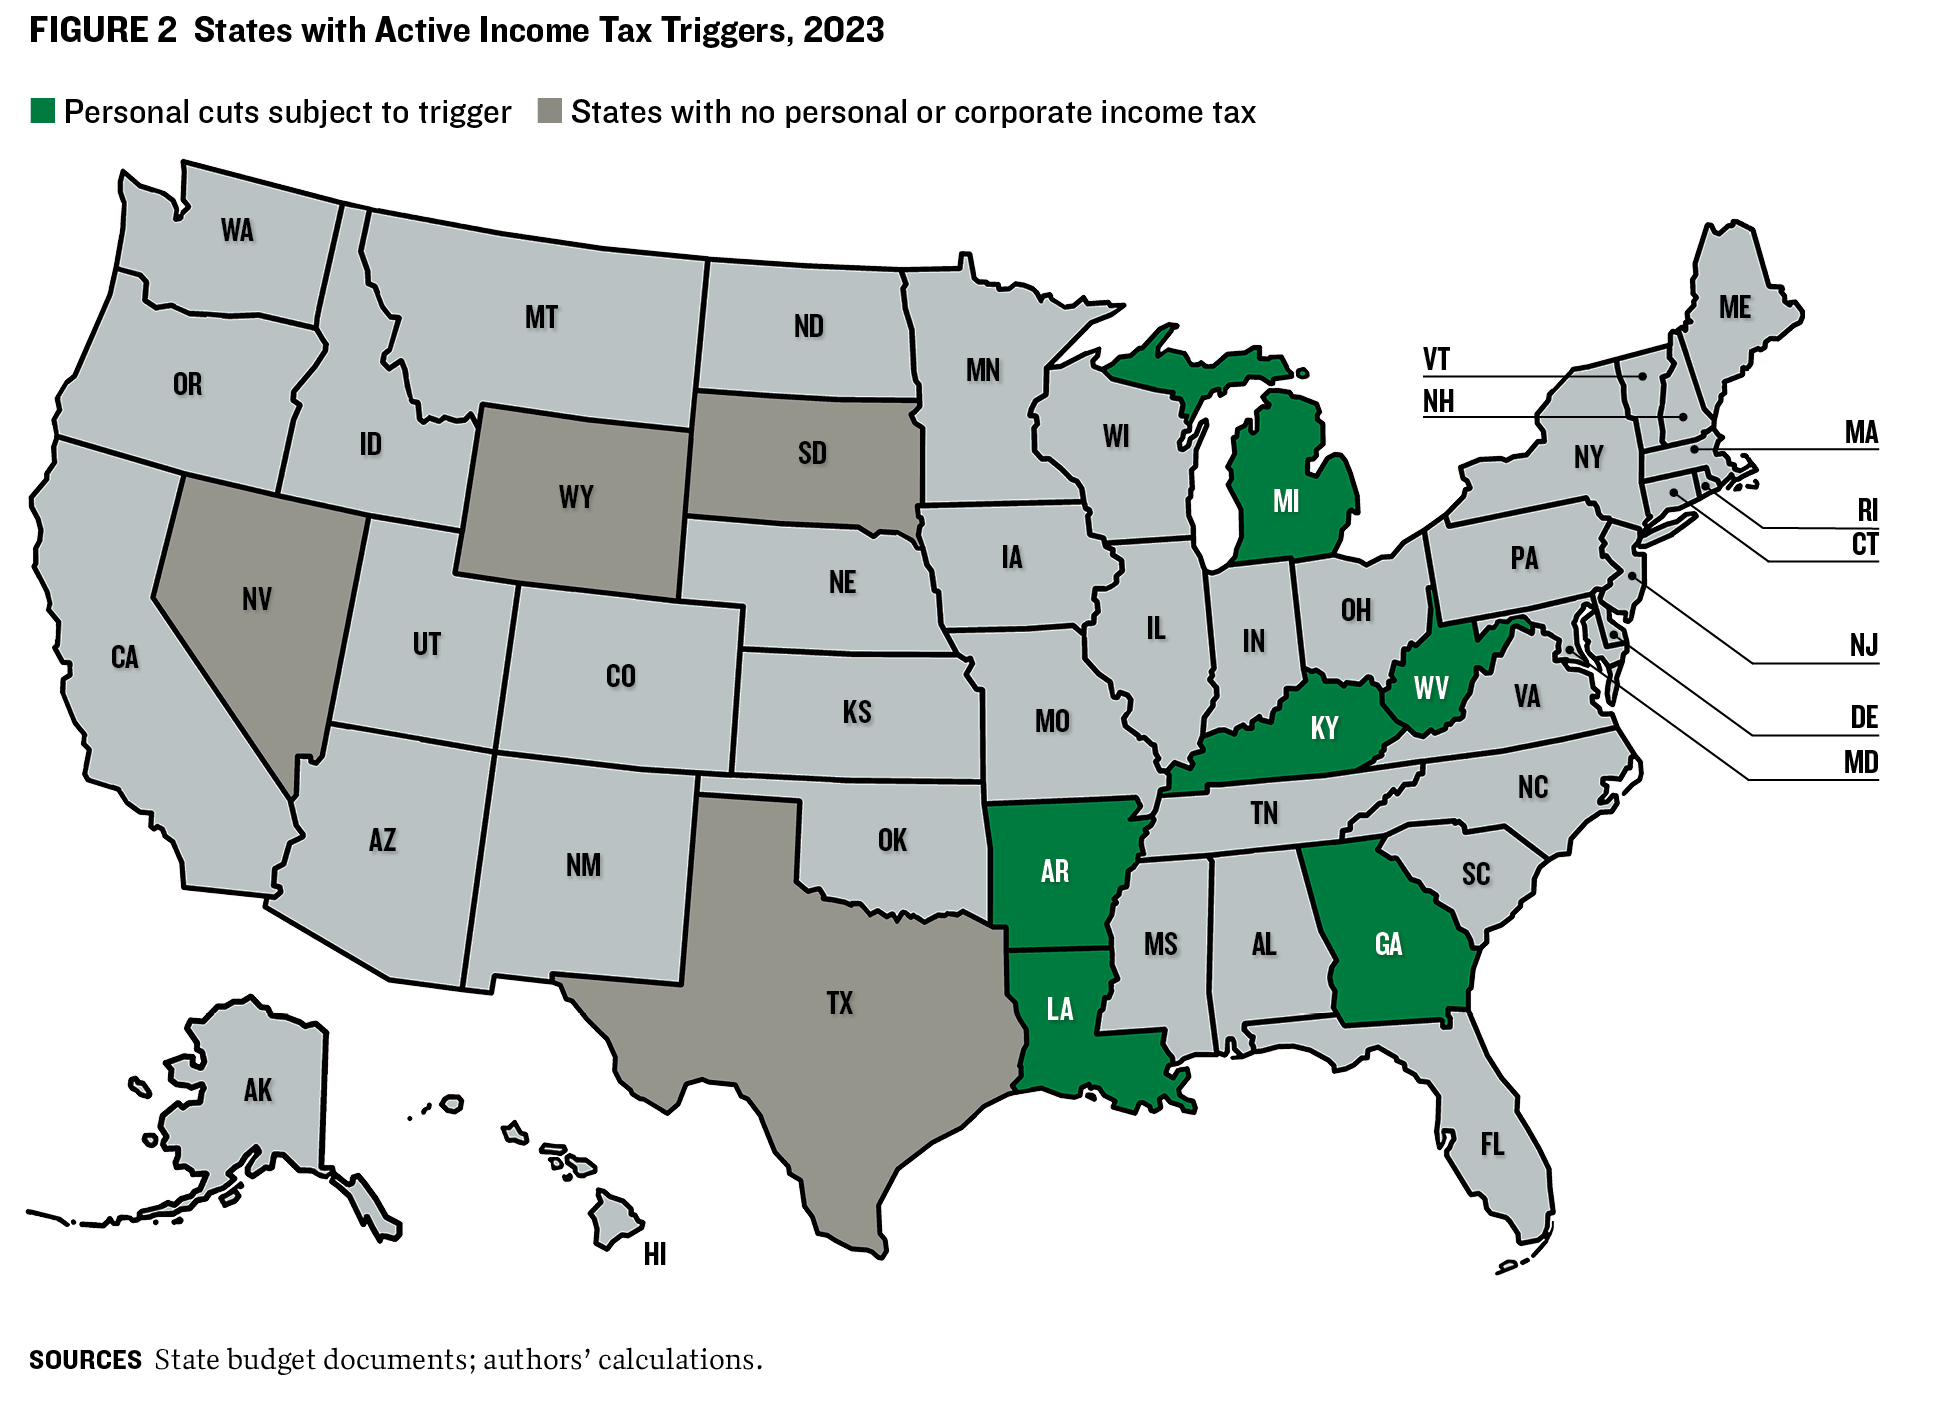
Tax triggers may permanently alter the tax rate. A recent example is Michigan’s cut in income tax rates for fiscal 2023. In this case, a 2015 state road–funding law established a complex formula to trigger an income tax rate cut when general fund revenues exceeded a certain threshold, adjusted for inflation, starting in 2023. Its robust economy and revenue growth helped the state reach the required level that year. The trigger was pulled, and Michigan reduced its income tax rate to 4.05 percent from 4.25 percent. In Indiana, legislators voted in 2023 to accelerate an income tax trigger, moving the timeline for implementing a rate reduction from 2029 to 2027.9
Well-designed triggers can bring much greater flexibility to tax relief implementation and provide a fiscally prudent mechanism to phase in tax cuts while protecting a state against the effects of future economic declines. At the same time, the Institute on Taxation and Economic Policy and the Center on Budget and Policy Priorities have warned that improperly structured tax triggers may be vulnerable to political manipulation and fiscal vagaries, which complicate the process of determining the true cost of tax cuts.10,11
Personal Income Tax
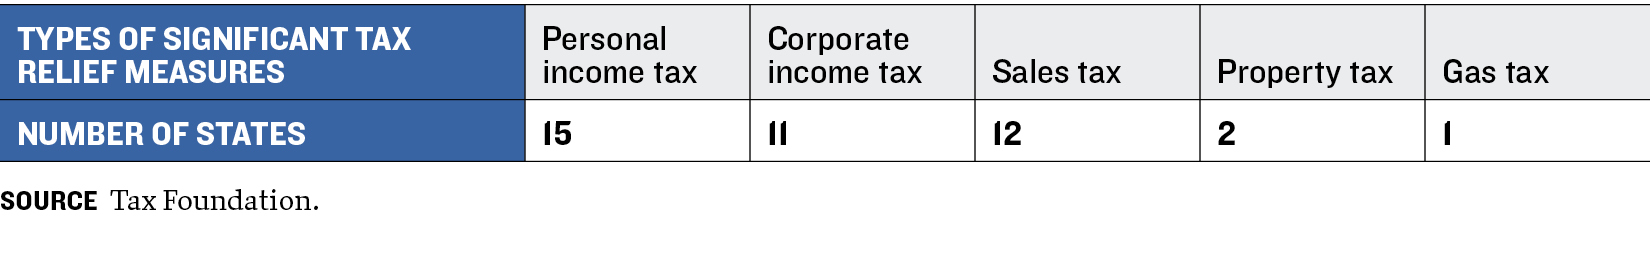
Personal income taxes accounted for 40 percent of state tax collections in fiscal 2020.12 Twenty-one states cut personal income tax rates in fiscal 2021. At least 31 cut them in 2022 (figure 3). Kentucky, Georgia, and Iowa enacted personal income tax reductions that will each exceed $1 billion annually, while Nebraska and Mississippi approved yearly cuts of over $500 million.
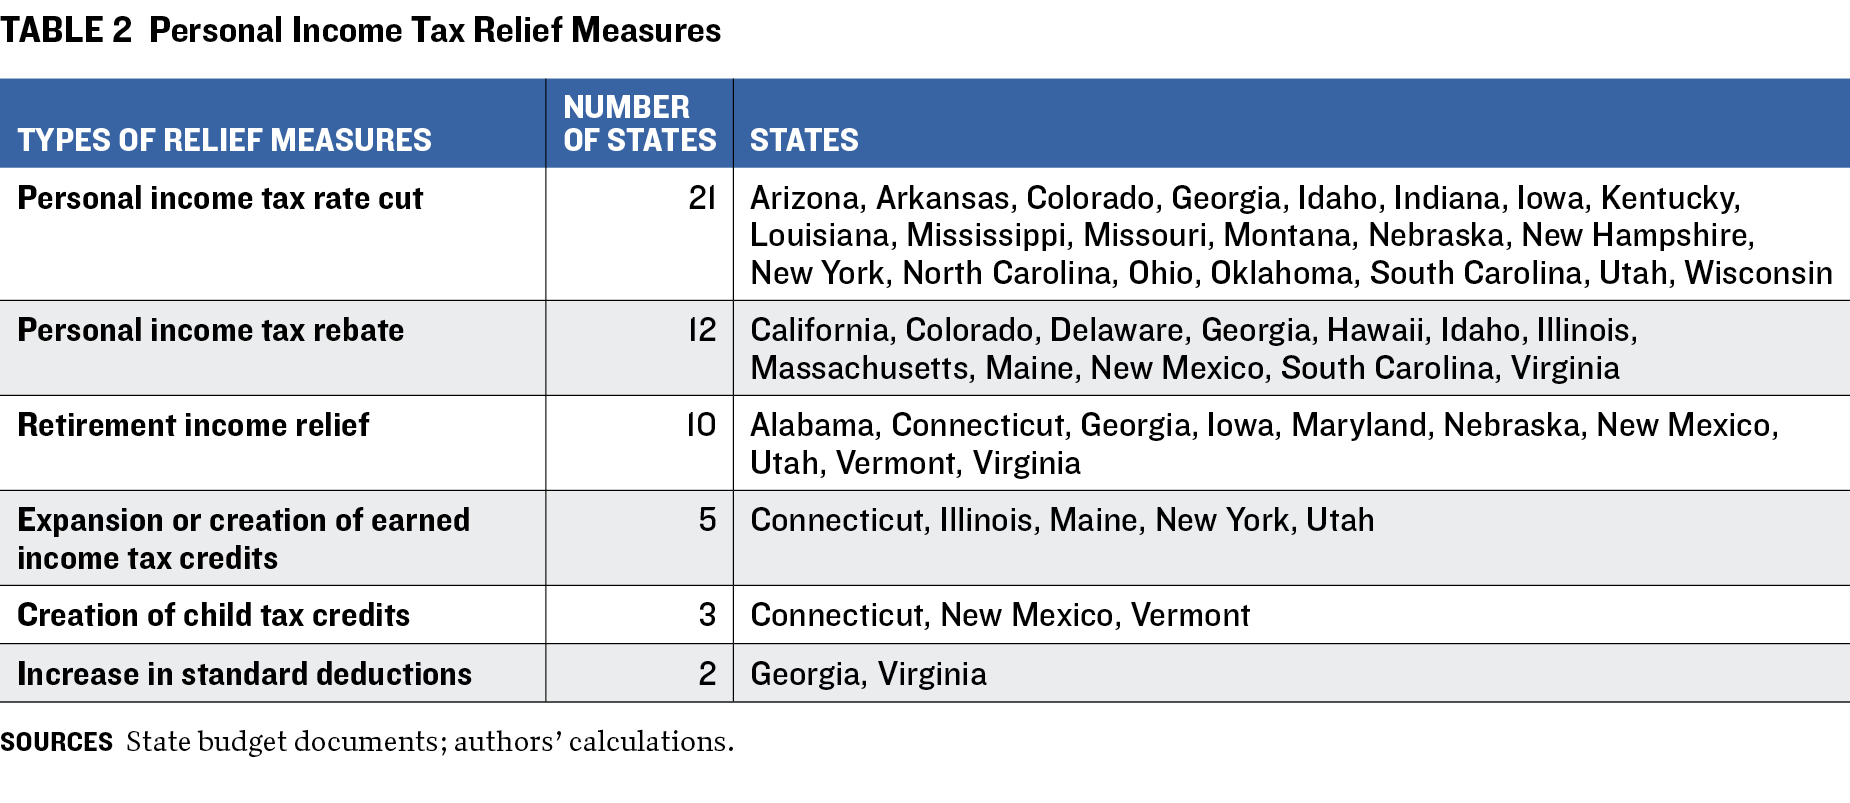
In many cases, the cuts to personal income tax rates will be phased in over several years or are contingent on revenue triggers that specify minimum levels of tax collections. Georgia, Iowa, and Mississippi shifted from a graduated tax-rate structure to a flat tax. Ten states, including Alabama, Nebraska, and Iowa, adopted legislation to provide beneficial tax treatment for Social Security or other retirement income.
In addition to their cuts to income tax rates, eight states enacted one-time personal income tax rebates in fiscal 2022 that cost hundreds of millions of dollars apiece. In South Carolina, rebate plans were estimated to cost $1 billion. Under terms of the Taxpayers Bill of Rights, enacted in 1992, Colorado will provide $400 for single filers and $800 for households with children. Illinois, meanwhile, gave individuals tax rebates of up to $700. To provide income relief for lower- and middle-income taxpayers, five states expanded or created earned income tax programs. For example, Indiana permanently expanded its earned income tax credits to noncitizens and raised the payment from 18 percent to 20 percent of the federal earned income credit.
Three states created new child tax credits. For instance, Vermont offered $1,000 annually per child under age 6 to families with adjusted gross income of up to $125,000. Georgia and Virginia13 increased the standard deduction for personal income tax. Georgia’s rose to $5,400 from $4,600 for single filers and to $7,100 from $6,000 for married couples filing jointly. These tax cuts will save the former up to $43 and the latter up to $63 per year, while reducing state income tax collections by $140 million.
Corporate Income Tax
Forty-four states levy a corporate income tax, which accounted for an average of 7 percent of state tax collections and 4 percent of state general revenues in fiscal 2021 (table 3). Corporate income tax rates in 2023 ranged from 2.5 percent in North Carolina to 11.5 percent in New Jersey.
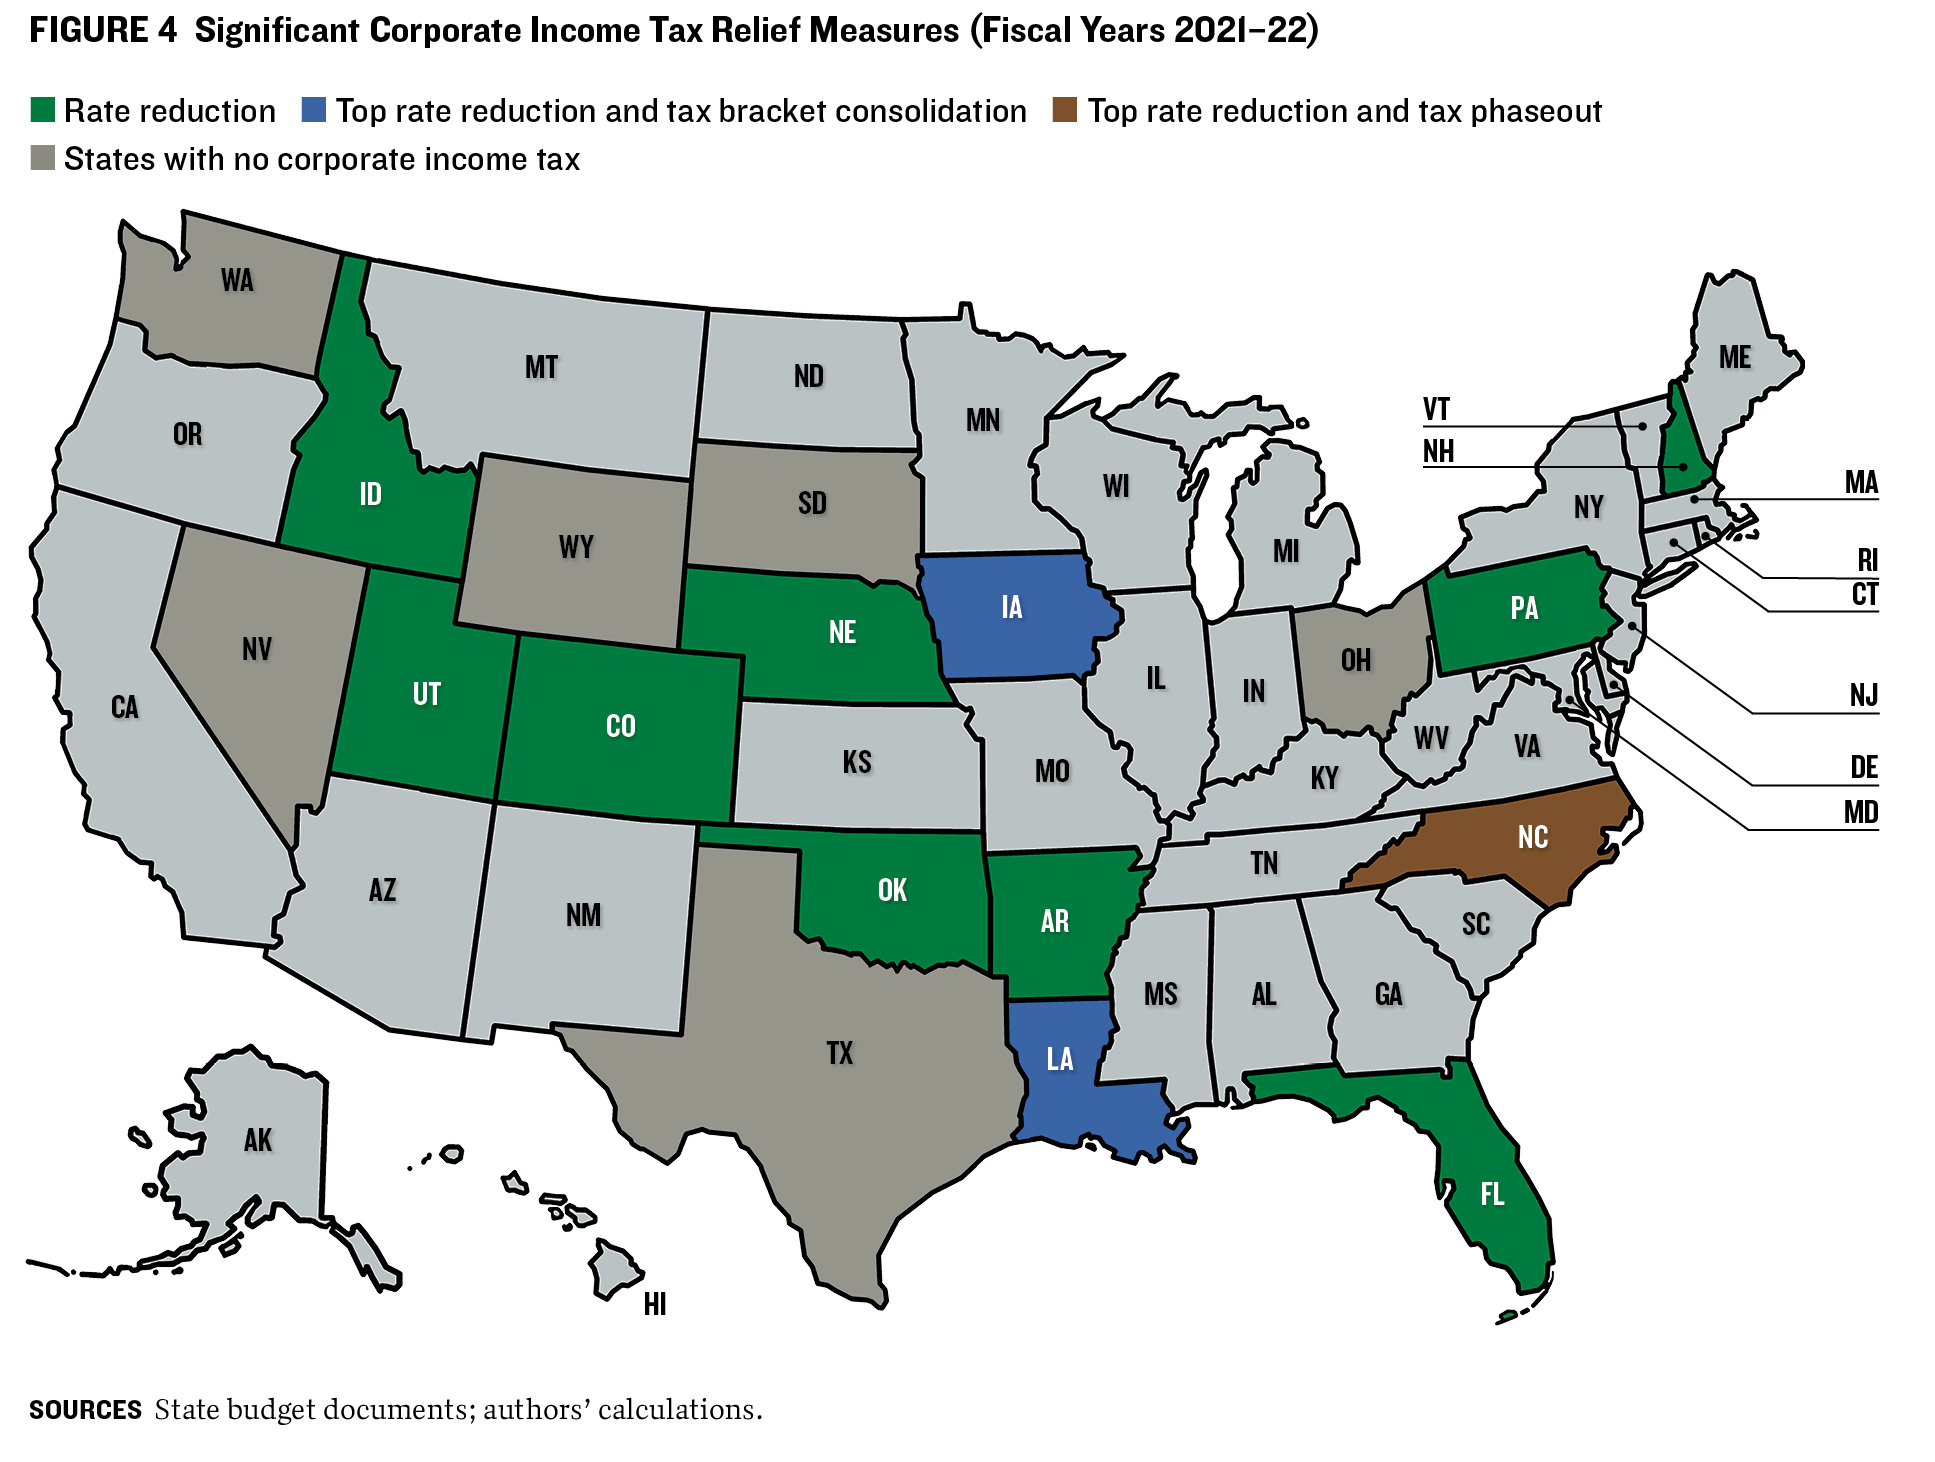
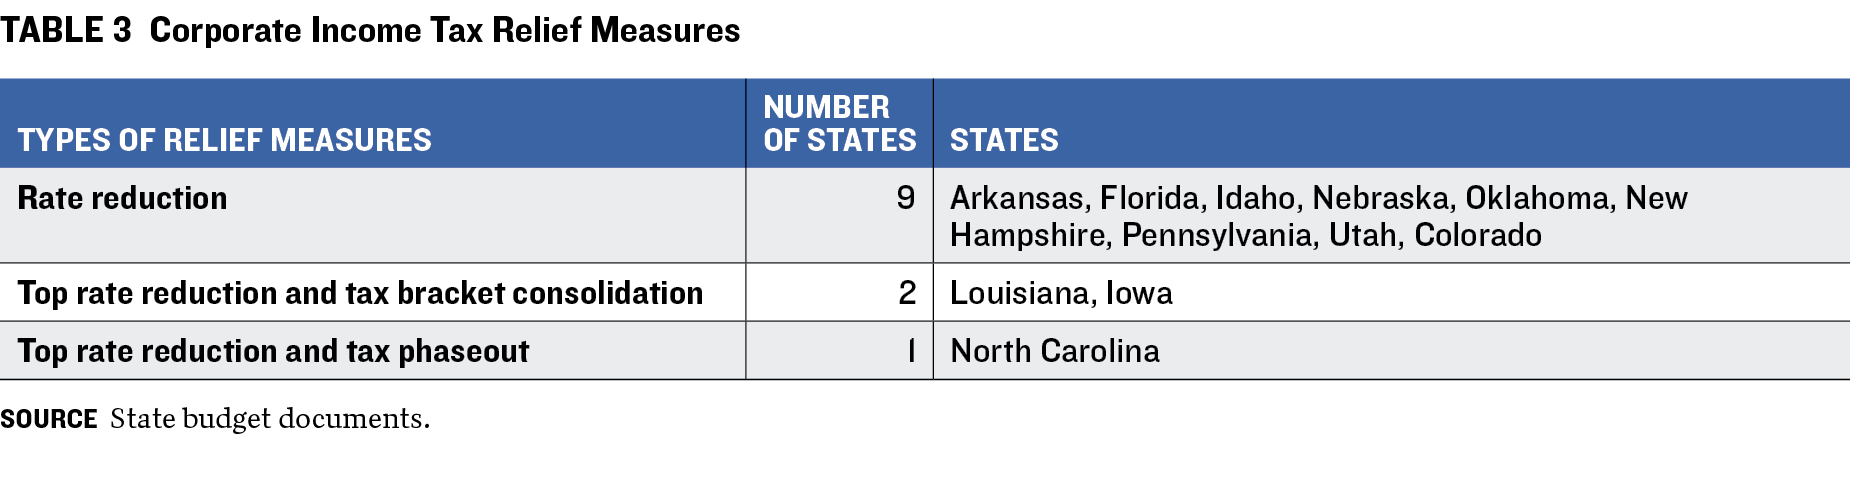
Over fiscal years 2021–22, twelve states reduced corporate income tax rates (figure 4). In November 2021, North Carolina’s appropriations act phased out the 2.5 percent corporate tax rate over five years, 2025–30. Louisiana consolidated a five-bracket corporate income tax system into three and cut the top rate 0.5 percentage point, to 7.5 percent, for fiscal 2022. Pennsylvania reduced the corporate net income tax rate from 9.99 percent to 8.99 percent on January 1, 2023. The rate then decreases by 0.5 percentage point annually until it reaches 4.99 percent at the beginning of 2031.
Sales Tax
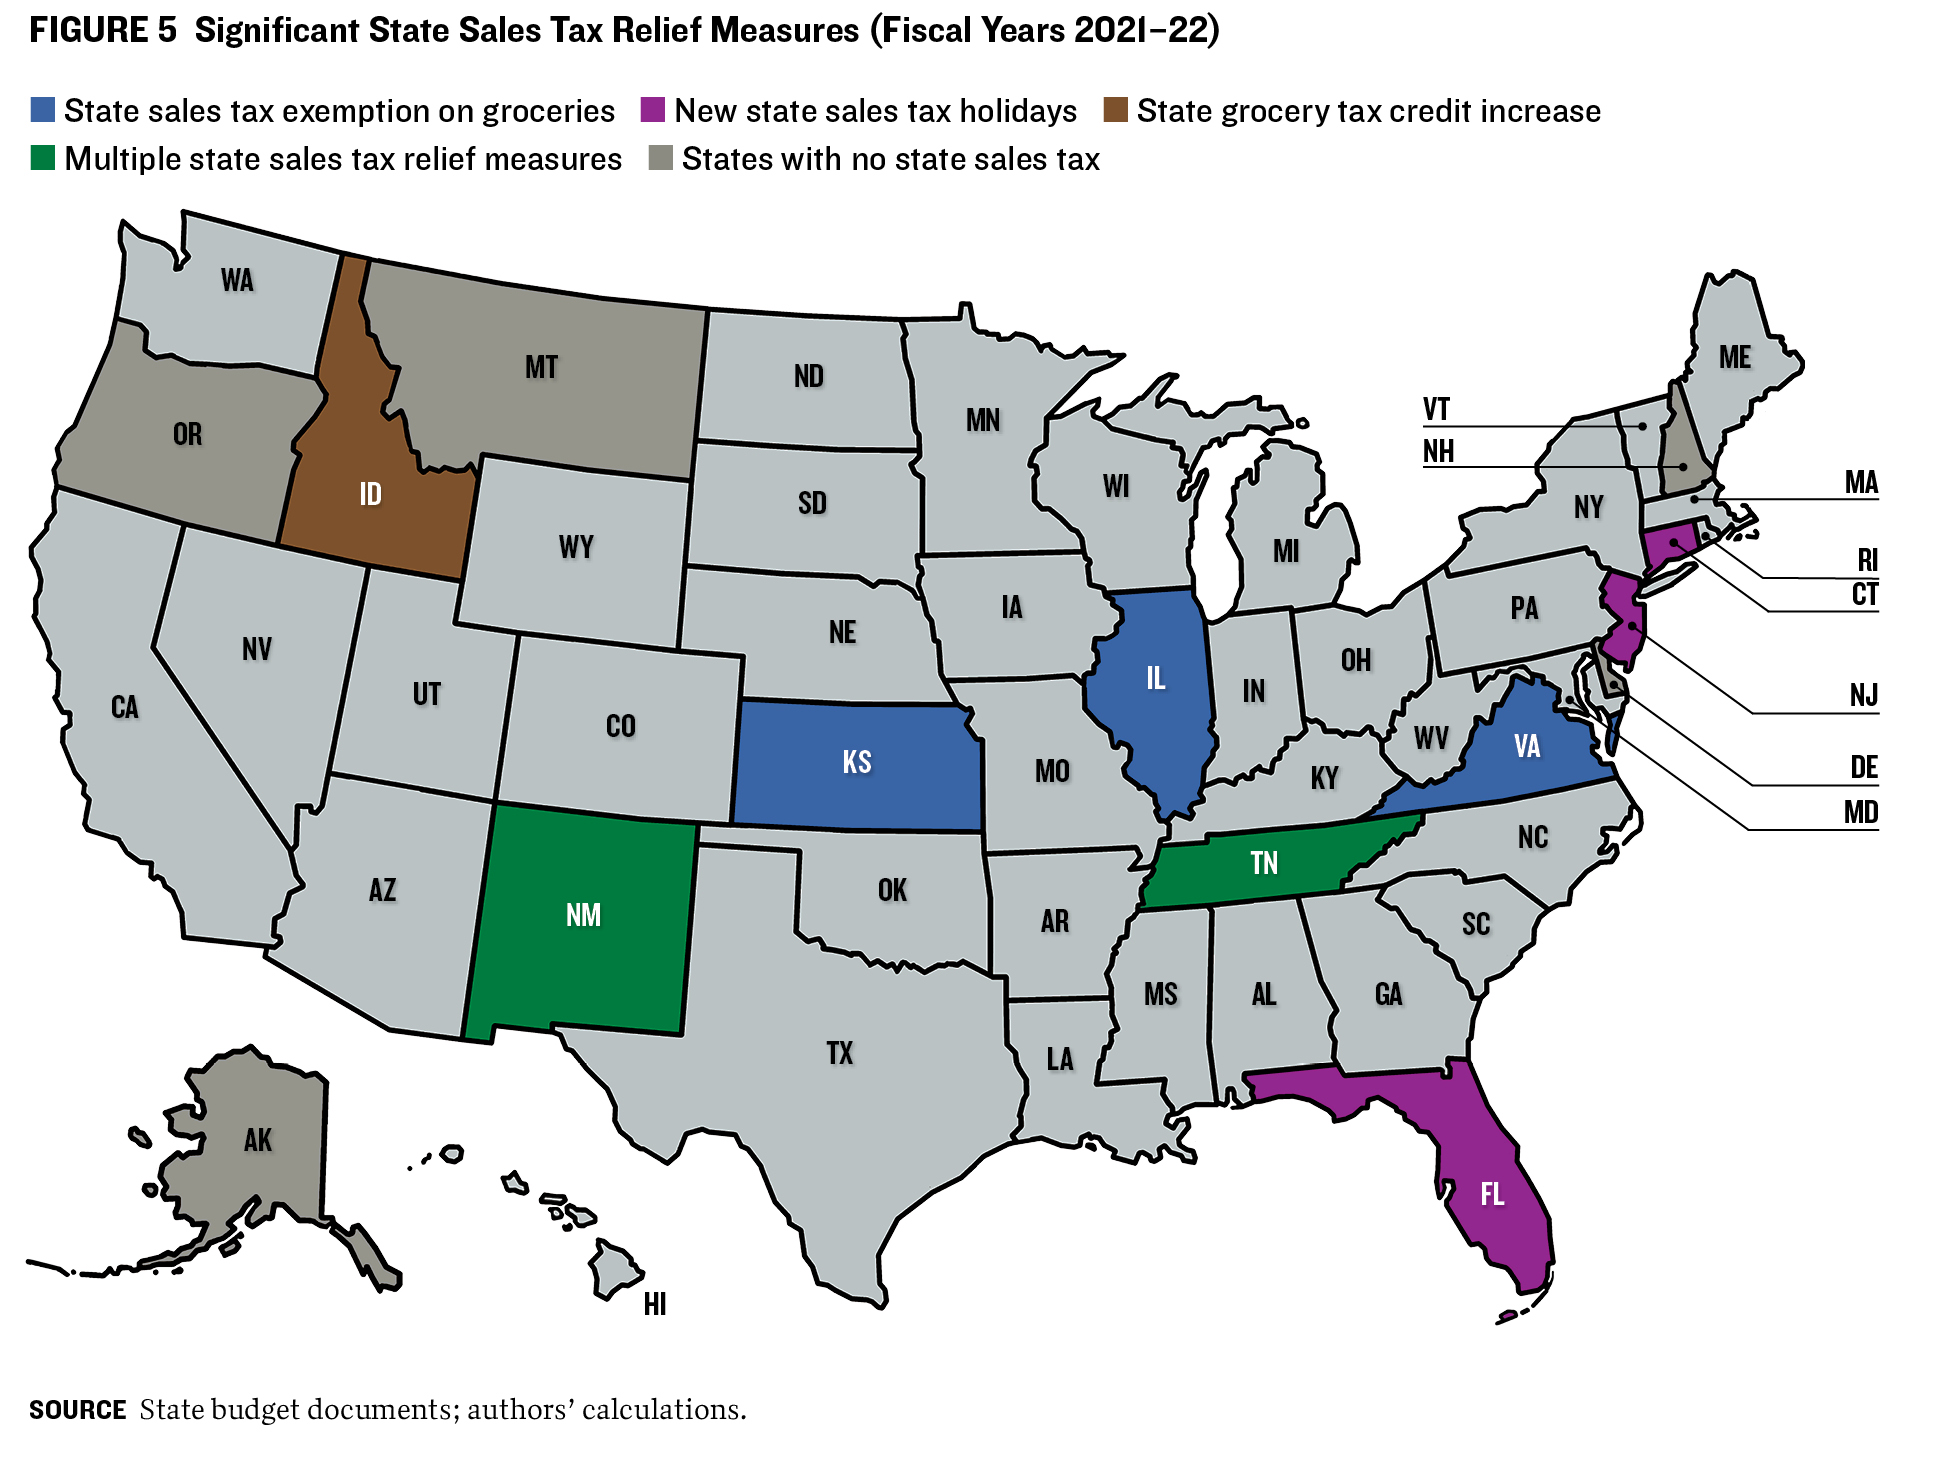
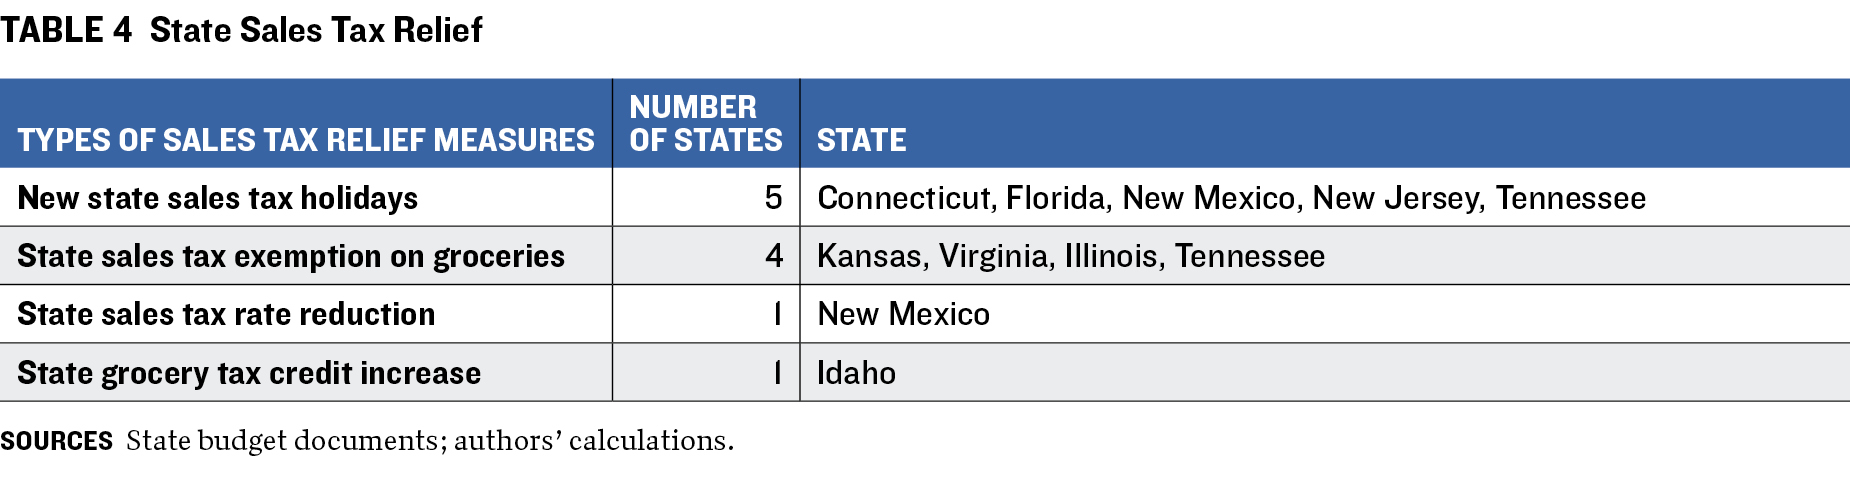
Sales taxes are also a major source of state government revenues (table 4). Forty-five states collect sales taxes, while five—Alaska, Delaware, Montana, New Hampshire, and Oregon—do not. The median sales tax rate in fiscal 2021 was 6.0 percent, which yielded $375 billion in revenues and accounted for nearly 30 percent of state tax collections.
In fiscal 2022, fourteen states proposed cutting sales tax rates, often to benefit consumers negatively affected by economic instability resulting from partial shutdowns during the pandemic. For instance, Kansas enacted a measure to phase out the 6.5 percent sales tax on groceries by fiscal 2025, while Illinois suspended its 1.0 percent sales tax on groceries for a year. Idaho raised the grocery tax credit by $20 per person, boosting the annual maximum credit from $100 to $120 for people under 65 and from $120 to $140 for those 65 and older, starting with tax returns for calendar year 2023.
Motor Fuel Tax
Motor fuel taxes on gasoline and diesel represent one of states’ most important revenue sources for funding transportation. They are the primary way states charge for road usage—following the logic that the more you drive, the more fuel you are willing to use, and therefore the more you should pay to maintain roads. Though all states currently levy a gas tax, rates vary widely. (On July 1, 2023, California had the highest gas tax rate—77.9 cents per gallon—while Mississippi charged the least, 18.4 cents.)14
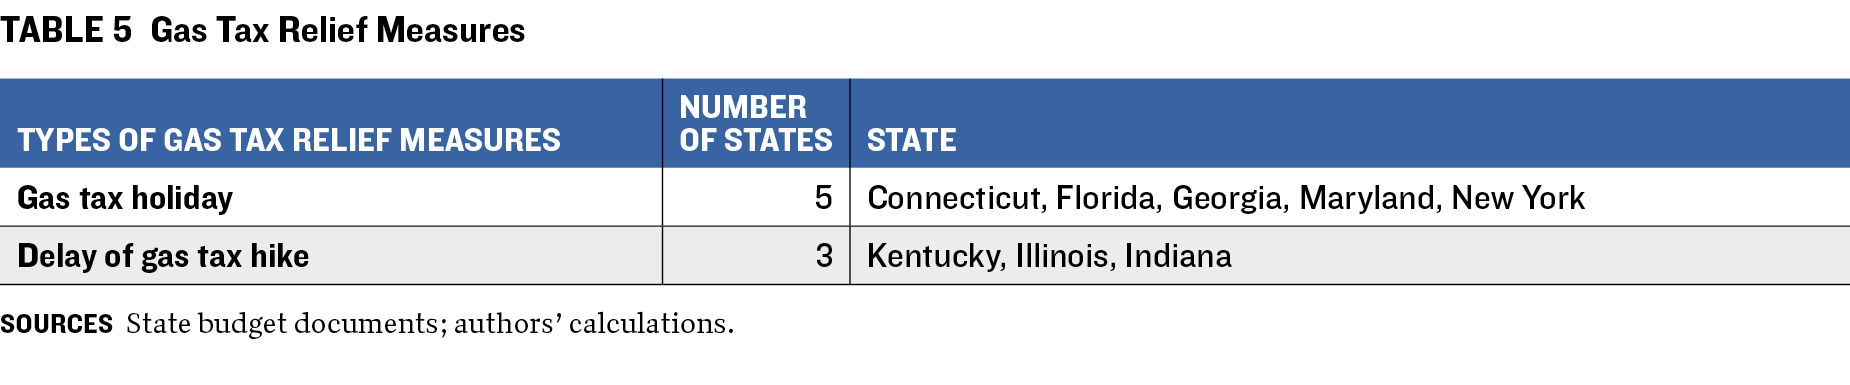
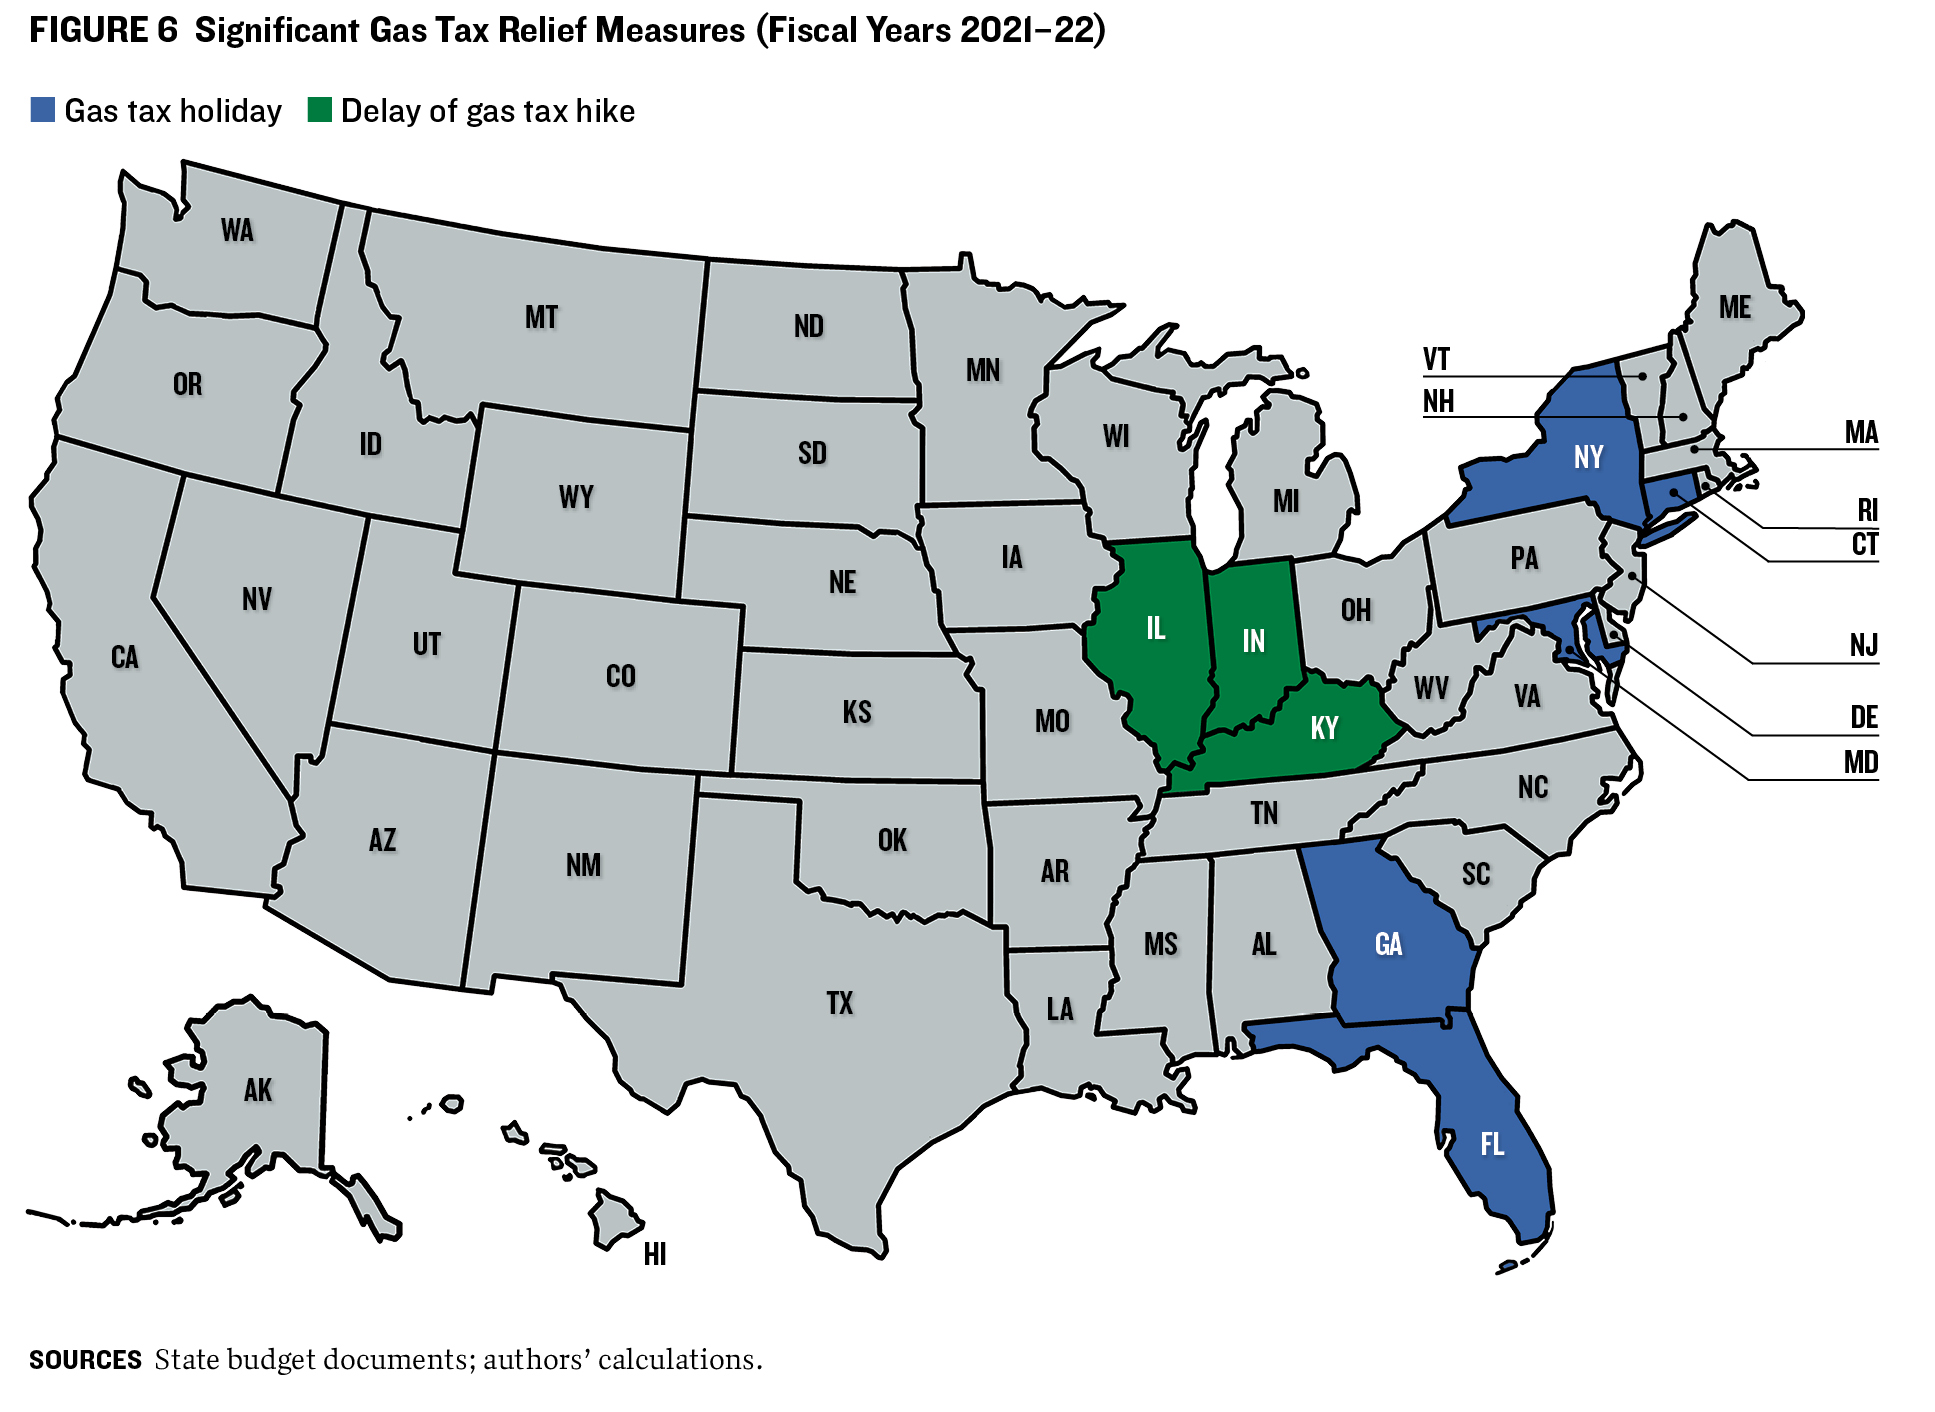 In fiscal 2022, twenty states considered legislation on motor fuel tax relief to address record-high gas prices. Five of those enacted temporary tax holidays ranging from one month to one year (table 5; figure 6). These measures reduced revenue from gas taxes by tens of millions of dollars to at least $1 billion. For instance, Georgia began a tax holiday in March 2022 and extended it seven times to reduce the impact of inflation. The moves cost an estimated $1 billion—an expense met by the state’s $6.6 billion budget surplus.15
Kentucky, Illinois, and Indiana suspended inflation adjustments to gas taxes. For example, in April 2022, the Illinois General Assembly delayed a two-cent rise in the state’s motor fuel tax.
Property Tax
Property taxes are the primary revenue source for local governments and generate state-level revenue for some (table 6). In 2021, property taxes accounted for 39.9 percent of combined state and local tax collections and 66.1 percent of local tax revenues.16 Local governments rely heavily on property taxes to fund schools, roads, and police and other public safety services.
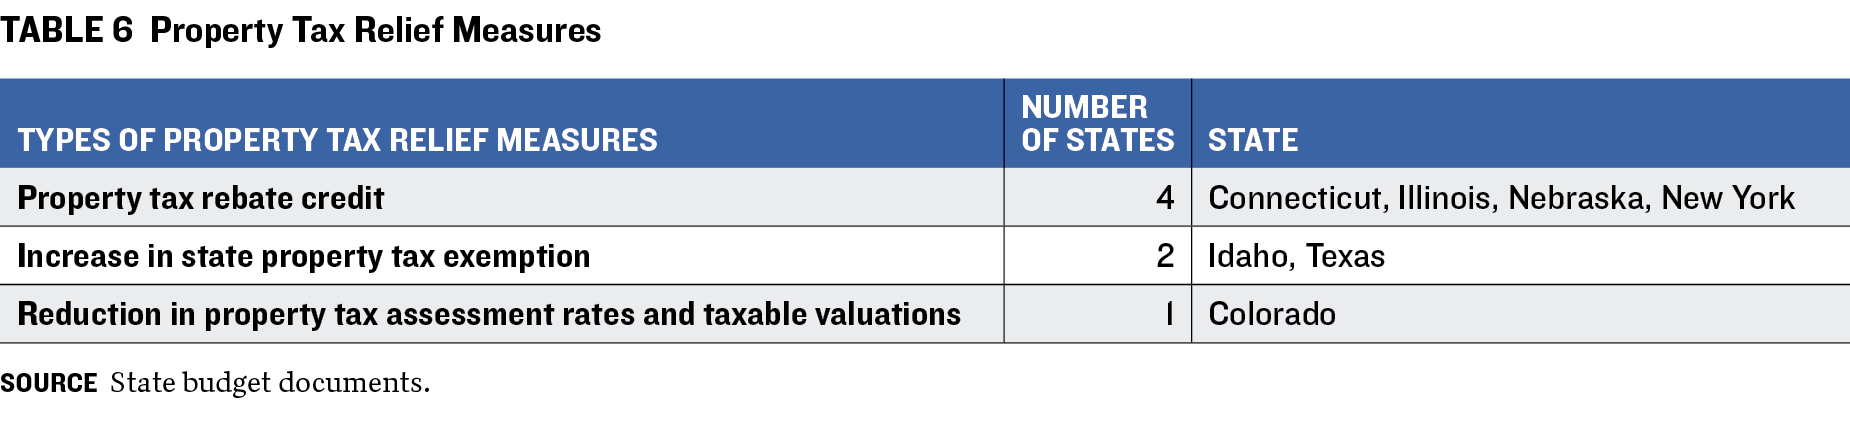
In response to the pandemic, states stepped up the pace of previous relief measures to reduce the burden of local property levies on homeowners and renters. For example, Connecticut, Illinois, Nebraska, and New York provided new property tax rebates in fiscal 2022 (figure 7). Illinois increased rebates to $300 for single filers earning up to $250,000 and for joint filers earning up to $500,000, while Connecticut raised its personal income tax credit for property taxes to $300 from $200. The credit was also extended to cover taxpayers beyond those over 65 or those who claim dependents on their federal returns.
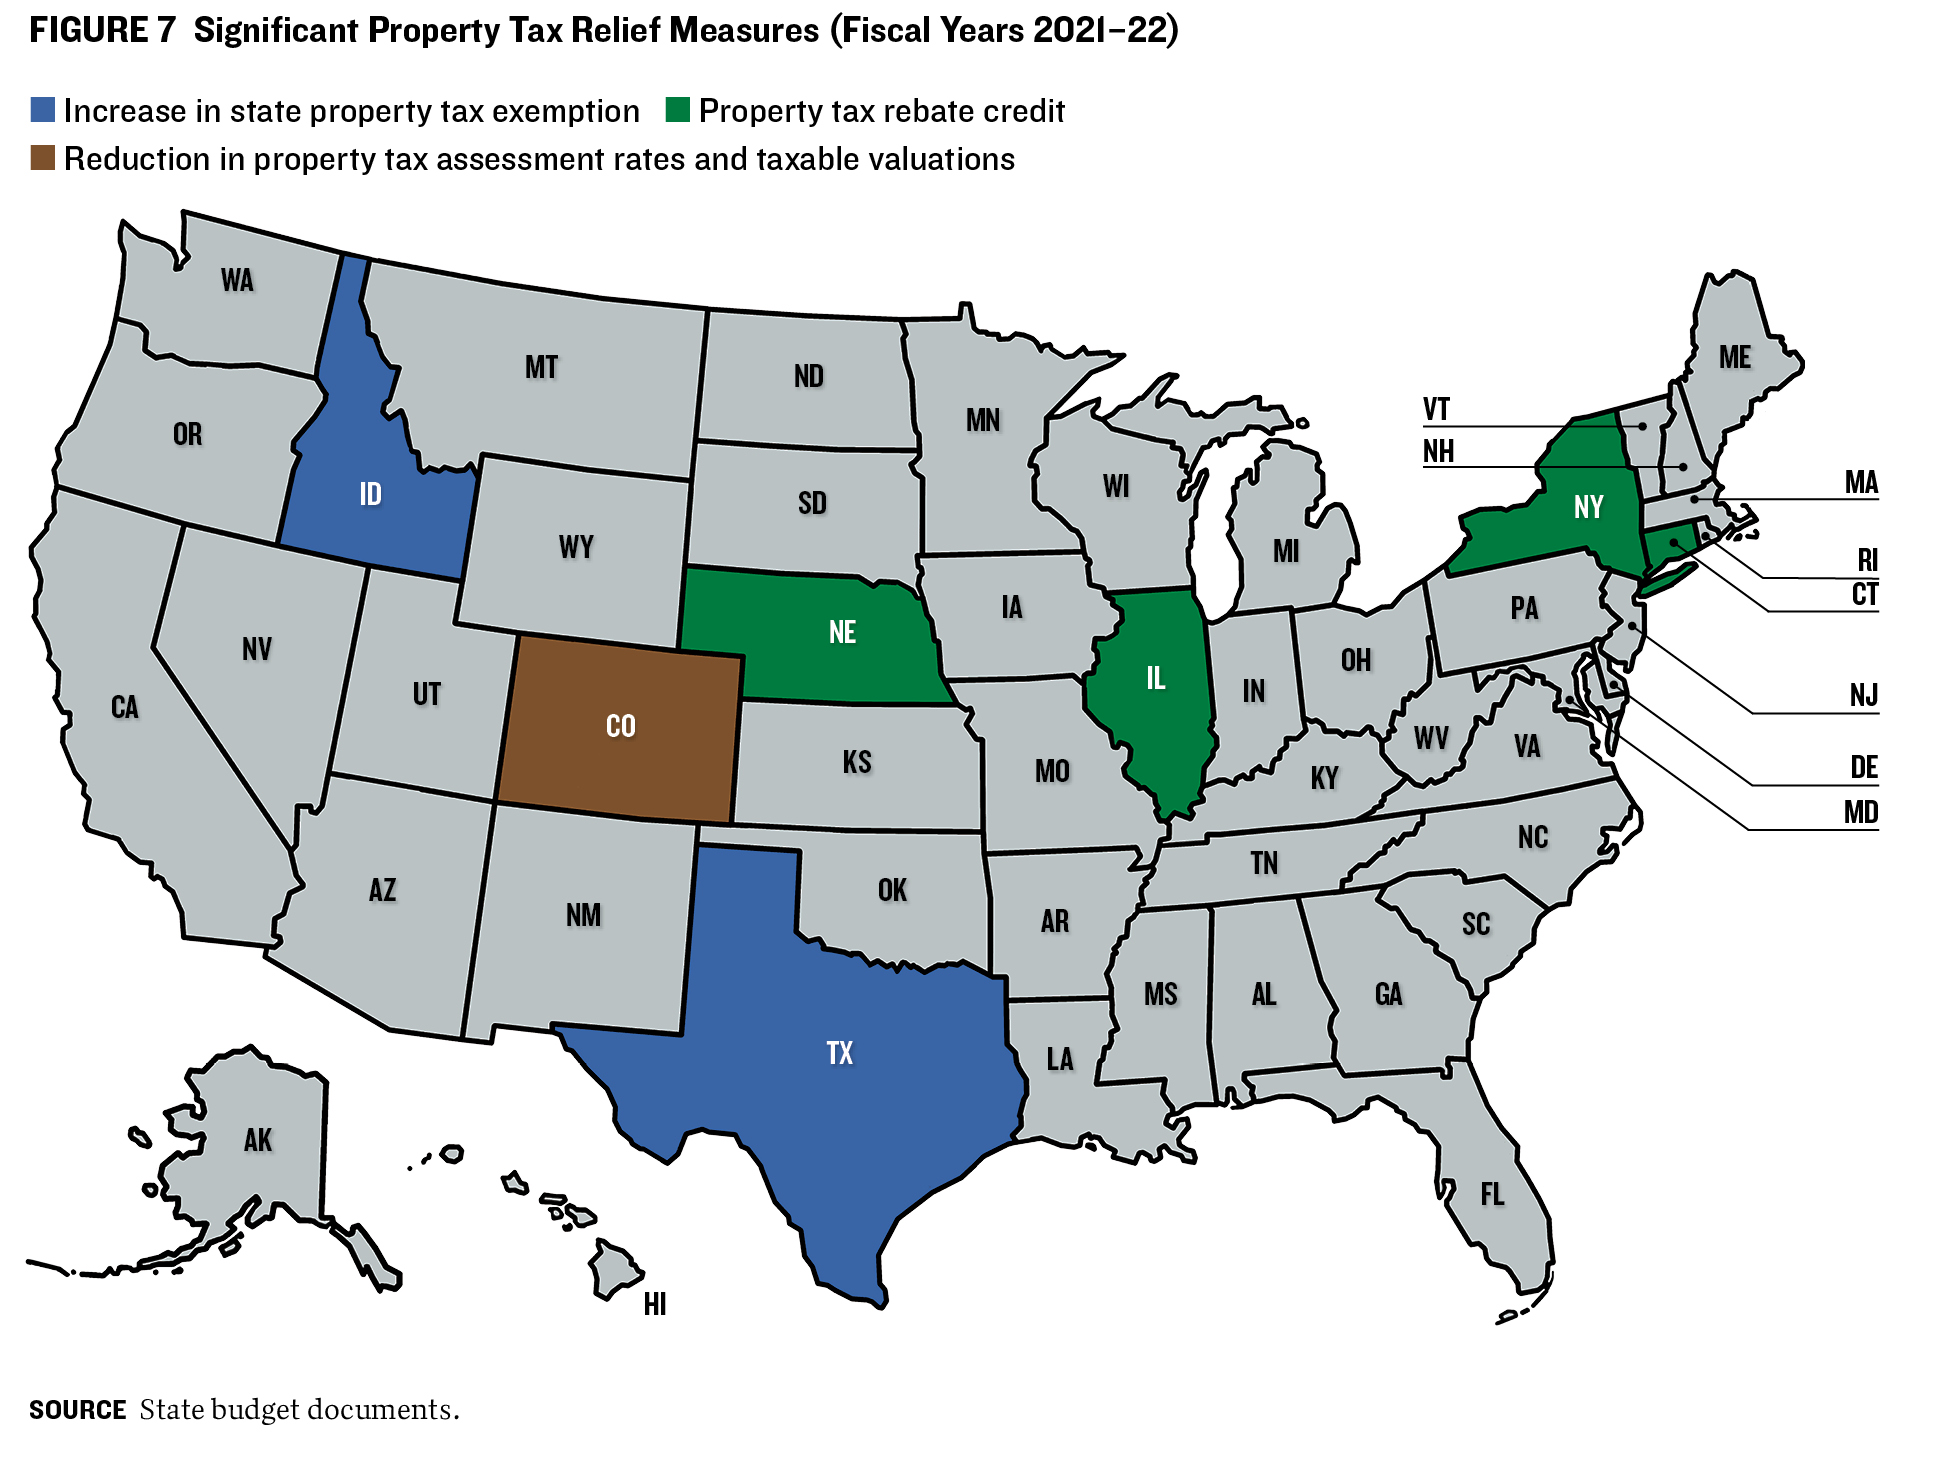
In addition, Idaho and Texas raised state property tax exemptions. Texas voters approved ballot measures that cut school district property taxes for homeowners who are at least 65 or who are disabled. The state also raised the homestead exemption—the tax-exempt amount of a home’s appraised value—to $40,000 from $25,000. Meanwhile, Colorado reduced property tax assessment rates and taxable valuations for fiscal 2023–24, thereby providing an estimated $700 million in relief.
States Countering the Trend by Raising Taxes
SOME STATES TARGETED millionaires and corporations to raise revenues during and after the pandemic, primarily through income tax changes:
• In April 2021, New York adopted its fiscal 2022 budget, which included various temporary tax increases. For tax years beginning January 1, 2021, through 2027, the top state personal income tax rate rose to a maximum of 10.90 percent from 8.82 percent.
• New York also temporarily boosted the income tax rate on certain businesses in 2021. Effective January 1, 2021, though the end of 2023, the so-called corporate franchise tax rate for Article 9-A taxpayers (general corporations, financial institutions, and S corporations) rose to 7.25 percent from 6.50 percent. The increase applied to any taxpayer with a business income base of more than $5 million for the tax year.
• In 2022, Massachusetts voters aimed to better fund public education, roads, bridges, and public transportation by approving a 4.0 percent tax on annual income that is above $1 million, on top of the state’s 5.0 percent flat income tax.
• In 2020, New Jersey enacted a millionaire tax, approving an increase of 1.78 percentage points to the previous 8.97 percent for taxpayers with incomes of $1 million–$5 million.
• In May 2021, Washington enacted a new capital gains tax equal to 7.0 percent of a resident’s adjusted long-term capital gains. As of January 1, 2022, this tax applies only to individuals, including owners of pass-through entities, and provides a deduction for the first $250,000 of capital gains.
• A handful of states enacted changes in excise taxes on recreational cannabis and tobacco. In March 2021, New York began regulating the sale and use of cannabis and imposed a state excise tax of 9.0 percent and a local levy of 4.0 percent on retail sales to consumers. New Jersey increased its Social Equity Excise Fee on recreational marijuana to $1.52 from $1.10 per ounce. Maryland increased taxes on a pack of cigarettes to $3.75 from $2.00 for fiscal years 2022–23.
CONCLUSION AND RECOMMENDATIONS
THE COMBINATION OF ONE-TIME federal pandemic funds and robust tax revenue growth in fiscal years 2021–22 created unanticipated revenue surpluses in many states and put them in a strong position to enact tax relief. Since the end of our study period, however, revenue growth has slowed for most states. Some have made efforts to maintain revenue collections, while many others have continued to enact tax cuts or offer one-time relief.
If another fiscal shock happens—like COVID-19 or the Great Recession of 2007–09—states that made permanent tax cuts may find themselves with depleted rainy day funds and less generous federal aid. Indeed, the National Association of State Budget Officers (NASBO) reported that total general fund revenue growth slowed to 0.9 percent in fiscal 2023 following two consecutive years of double-digit increases. NASBO estimated that revenues would fall 1.8 percent in 2024.17
With this in mind, we present four strategies that state governments should consider when enacting tax reductions, along with illustrations of strategies that should be emulated or approached with caution due to their inherent risks:
Implement tax policy changes that are temporary and require reevaluation.
States may benefit from making temporary tax reductions and periodically reevaluating them in the context of current and projected economic and fiscal trends before adjusting or expanding them. The same process should be applied to tax increases. New York’s corporate income tax rate hike in fiscal 2021–24 is more fiscally prudent than a permanent increase and invites greater scrutiny of the change’s effectiveness if policymakers look to extend the provision.
LOWER-RISK STRATEGIES
Illinois, Delaware
IN APRIL 2022, Illinois adopted the Family Relief Plan, which provided about $1.8 billion in tax relief measures. The plan included one-time personal income and property tax rebates, as well as temporary cuts in several sales taxes. Illinois created three temporary tax holidays: a one-year suspension of the groceries sales tax; a delay of a scheduled increase in the motor fuel tax; and a one-day reduction of sales tax, to 1.25 percent from 6.25 percent, on certain clothing and school-related items.
The 2022 Delaware Relief Rebate Program authorized more than $180 million worth of one-time payments to taxpayers to help with rising gas and grocery prices. The program was fully funded through a budget surplus.
HIGHER-RISK STRATEGY
Wisconsin
WISCONSIN PASSED A SERIES of permanent personal income tax cuts during and after the pandemic. In 2022, the state provided tax relief for middle-income taxpayers by cutting the third income tax bracket rate to 5.30 percent from 6.27 percent for those with taxable income of $24,250–$266,930. This represented the largest single-year reduction in that bracket since the late 1980s and was estimated to lower personal income tax collections by $1 billion in fiscal 2022.18 This tax cut equates to over 11 percent of the state’s personal income tax revenue collection and over 5 percent of its general fund expenditure in fiscal 2022. Wisconsin was in a strong financial position at the time and had a record budget surplus. But these permanent and sizable income tax rate cuts may significantly constrain future state revenues and impose long-term fiscal challenges if economic output falls and unemployment rises.
Incorporate well-designed trigger mechanisms to make prudent tax measure phase-ins.
Revenue triggers can help limit the volatility and unpredictability associated with changes in tax policy. Strong trigger mechanisms will specify baseline revenue levels and establish meaningful benchmarks that mitigate the influence of year-over-year revenue volatility.
LOWER-RISK STRATEGY
Georgia
GEORGIA’S TAX REDUCTION AND REFORM ACT of 2022 implemented large rate changes over a period of years. The state adopted an extra layer of fiscal caution by incorporating three triggers.19 First, in order for the rate changes to kick in, the governor’s revenue estimate for the next fiscal year must be 3.0 percent above the revised estimate for the current year. Second, net revenue collections in the previous fiscal year must be higher than those in each of the preceding five fiscal years. Third, the state’s rainy day fund must contain an amount that exceeds any decrease in state revenues projected to result from the reduction in the tax rates set to occur the following year.20
HIGHER-RISK STRATEGY
Iowa
IN MARCH 2022, Iowa passed a large tax reduction program to phase in a flat personal income tax rate of 3.9 percent by 2026 and lower the top corporate tax rate to 8.4 percent from 9.8 percent. The measure did not include trigger provisions. These permanent cuts represented over 41 percent of state personal and corporate income tax revenue collections in fiscal 2022.21 They have also proved controversial with the public and are considered by some to be unsustainable cuts enhanced by pandemic assistance.22
Use refundable tax credits to provide targeted and more fiscally affordable tax relief measures for those who need it most.
Permanent and broad-based tax rate reductions disproportionately benefit the wealthy, as low-income households may not earn enough taxable income to benefit from lower income tax rates. By contrast, targeted and refundable tax credits, such as earned income tax credits, provide greater relief to low-income families.
LOWER-RISK STRATEGY
Maine, Connecticut
MAINE ADOPTED a supplemental budget in April 2022 that provided several tax relief measures, including refundable tax credits for low- and middle-income property owners and an expansion of the state’s earned income tax credit by an average of $400 per family. Maine’s cautious approach to state revenues dedicates almost 75 percent of its budget surplus to one-time revenue initiatives. Similarly, Connecticut raised the earned income tax credit by 10.0 percentage points and implemented a tax rebate program in which certain businesses could earn rebates based on wage levels and the addition of full-time employees.
Use long-term forecasts to inform changes in tax policy.
State policymakers should use fiscal planning tools, such as multiyear forecasts and legislative fiscal notes, to identify medium- and long-term fiscal challenges. Such forecasts should be transparent and easily accessible to the legislature and citizens. Florida, for example, makes its multiyear forecasts widely available and highlights the potential long-term impact of current legislation.
States should also prepare budget stress tests to anticipate and craft prudent fiscal responses to potential economic downturns. Such exercises are vital in identifying and planning for fiscal risks, for policymakers as well as the public. Pioneered in states such as Utah, these evaluations can provide an array of paths forward each with some level of fiscal risk.
Although many states have emerged from the pandemic with budget surpluses and robust rainy day funds, policymakers should be wary of using temporary windfalls to pursue large or permanent tax reductions. Even if state fiscal situations look positive, undermining sizable sources of tax revenues today may lead to steep spending cuts or tax hikes in the future.
The fiscal consequences of state tax relief measures depend on the size and permanence of the revenue reduction, the level of reserve funds, and the impact of the economy on tax collections. Proponents argue that immediate, permanent tax cuts will attract new residents and bolster growth and tax revenues. But that bet may be hazardous if anticipated revenue growth fails to materialize and states instead are inching toward a fiscal cliff. By contrast, tax cuts in the form of temporary rate reductions, rebates and holidays, targeted exemptions, and expanded tax credits generally have more modest effects on long-term revenues and may be more fiscally responsible ways to offer meaningful—and sustainable—tax relief.
APPENDIX: State Tax Policy Tool Kit
THE FOLLOWING CHAPTERS PROVIDE a suite of resources for policymakers, municipal market investors, individuals, and other stakeholders who want to learn more about state revenues and expenditures as well as how they may be affected by changes in tax policy. We also include a set of case studies on recent state tax policy changes and how they are expected to impact revenue collections.
1. CASE STUDIES OF PANDEMIC-ERA TAX RELIEF MEASURES
In this chapter, we look in detail at several states’ reductions in income and sales taxes and tally the cost of rate reductions, changes from progressive to flat rates, and temporary holidays. We explore Iowa’s innovative restructuring of high corporate tax rates and how that move is being financed in part by eliminating certain tax credits.
Personal Income Tax
Rate Changes
Many states supplemented federal stimulus payments with income tax rebates to combat the longer-term economic effects of the pandemic. The last stimulus payments from the federal government were released in March 2021 as part of the American Rescue Plan Act.24 Although these payments supported individuals and families during restrictive lockdowns in 2020 and 2021, the years since have been marred by high inflation and gas prices that significantly increased costs for American households. Some states drew from the federal fiscal policy handbook by providing income tax rebates for residents, with most states explicitly citing food and gas inflation as key motivations for these payments.
In California, where some residents received as much as $1,050 in direct payments as part of the 2022 budget, a joint announcement by the governor, Assembly speaker, and Senate president highlighted the tax break and emphasized that the budget “prioritizes getting dollars back into the pockets of millions of Californians who are grappling with global inflation and rising prices of everything from gas to groceries.”25 Similar rhetoric appears to have informed decisions by Georgia and Idaho to provide rebates in 2022.
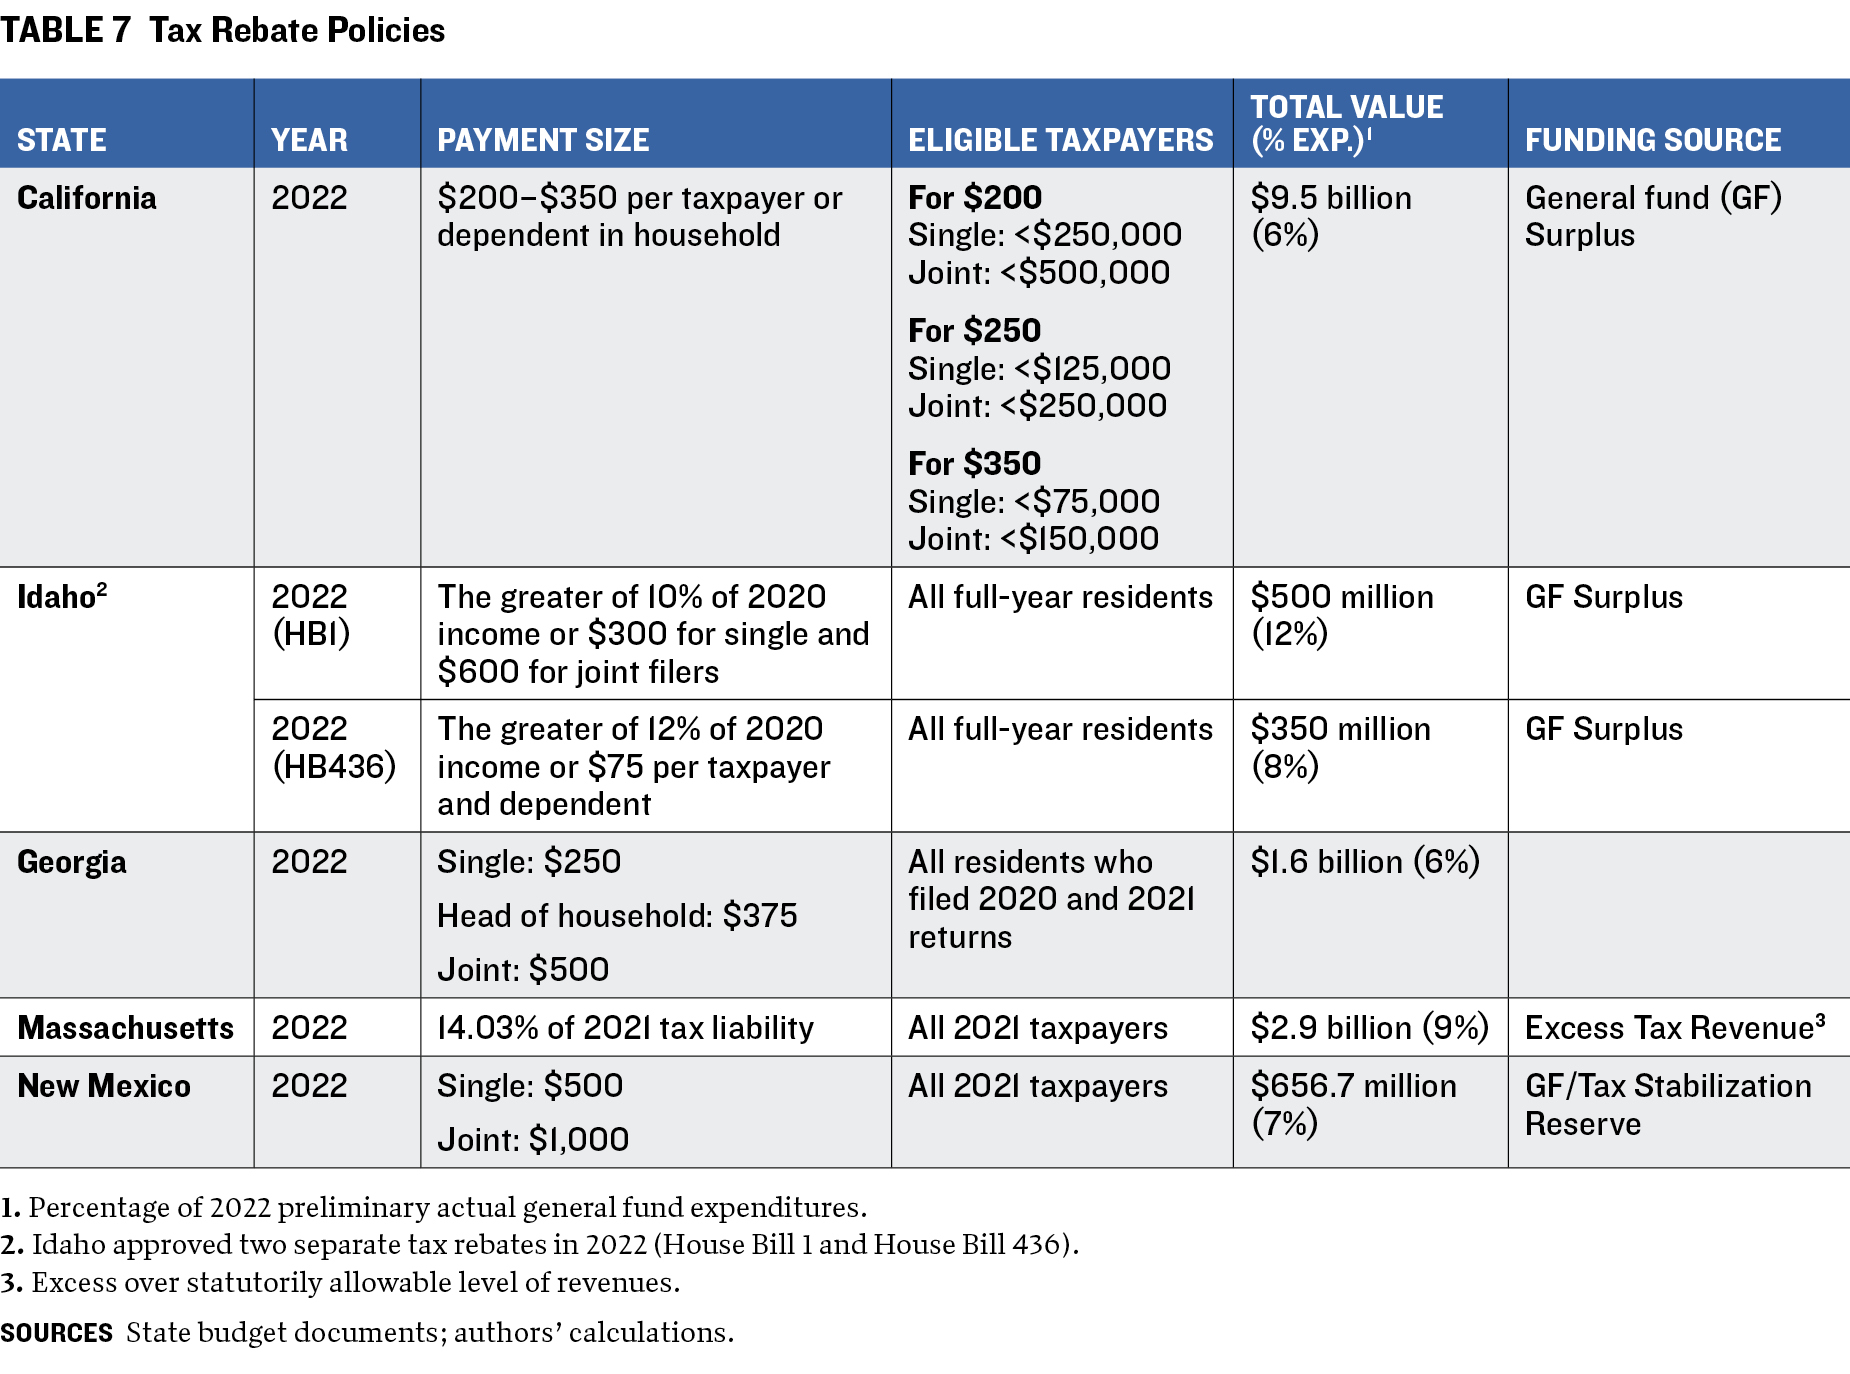
Several states implemented regressive tax rebate policies with a significant range of payment sizes. Of the states considered in this section, only California implemented a policy with income-graduated tax rebates. The highest payments went to single filers making less than $75,000 and joint filers making less than $150,000; the lowest went to single filers making $125,000–$250,000 and joint filers making $250,000–$500,000. Californians who earned above these amounts did not receive tax rebates, in sharp contrast to states such as Massachusetts, where a person earning $1 million was eligible for a rebate of up to $7,000 (assuming a 5.0 percent personal income tax rate and no deductions or credits).
The wide payout range is largely attributable to programs—like those of Massachusetts and Idaho—that calculate rebate amounts as a percentage of the previous year’s tax liability and have no income limits. Other states, such as California, which distributed payments ranging from $200 to $1,050, determined payments based on adjusted gross income reported for 2020 as well as number of dependents.
These payments came at significant financial cost to states and were funded largely from general funds and excess revenues. Among the states featured in table 7, Idaho’s rebate payments were the most expensive by far relative to the budget, costing $850 million, or about 20 percent of general fund expenditures in 2022.
While California and Massachusetts financed tax rebates from excess tax revenues, New Mexico approved a $200 million transfer from reserves to supplement the general fund if it could not support the payments. Idaho, meanwhile, paid for its tax rebate entirely from the state’s record budget surplus.26
Structural Changes
Some states have undertaken comprehensive restructuring of income tax by eliminating personal income taxes or shifting to a flat tax rate. Lawmakers in Iowa, Mississippi, and South Carolina have implemented gradual changes to flatten the personal income tax structure. Table 8 shows how income tax rates for various tax brackets will change because of these policies.
In Iowa, personal income tax brackets will flatten from a progressive four-tier structure of 0.33–8.53 percent to 3.90 percent for all income levels. This change will increase taxes for the lowest earners while eventually reducing taxes for Iowans earning over $7,000 annually. Iowa also eliminated income taxes on retirement income, which is expected to cost the state about $217.0 million in 2023 and $1.7 billion by 2028.27 In Kentucky, the 4.5 percent personal income tax will be reduced by 0.5 percentage point per year until it hits zero and is eliminated, provided that general fund receipts meet certain thresholds.
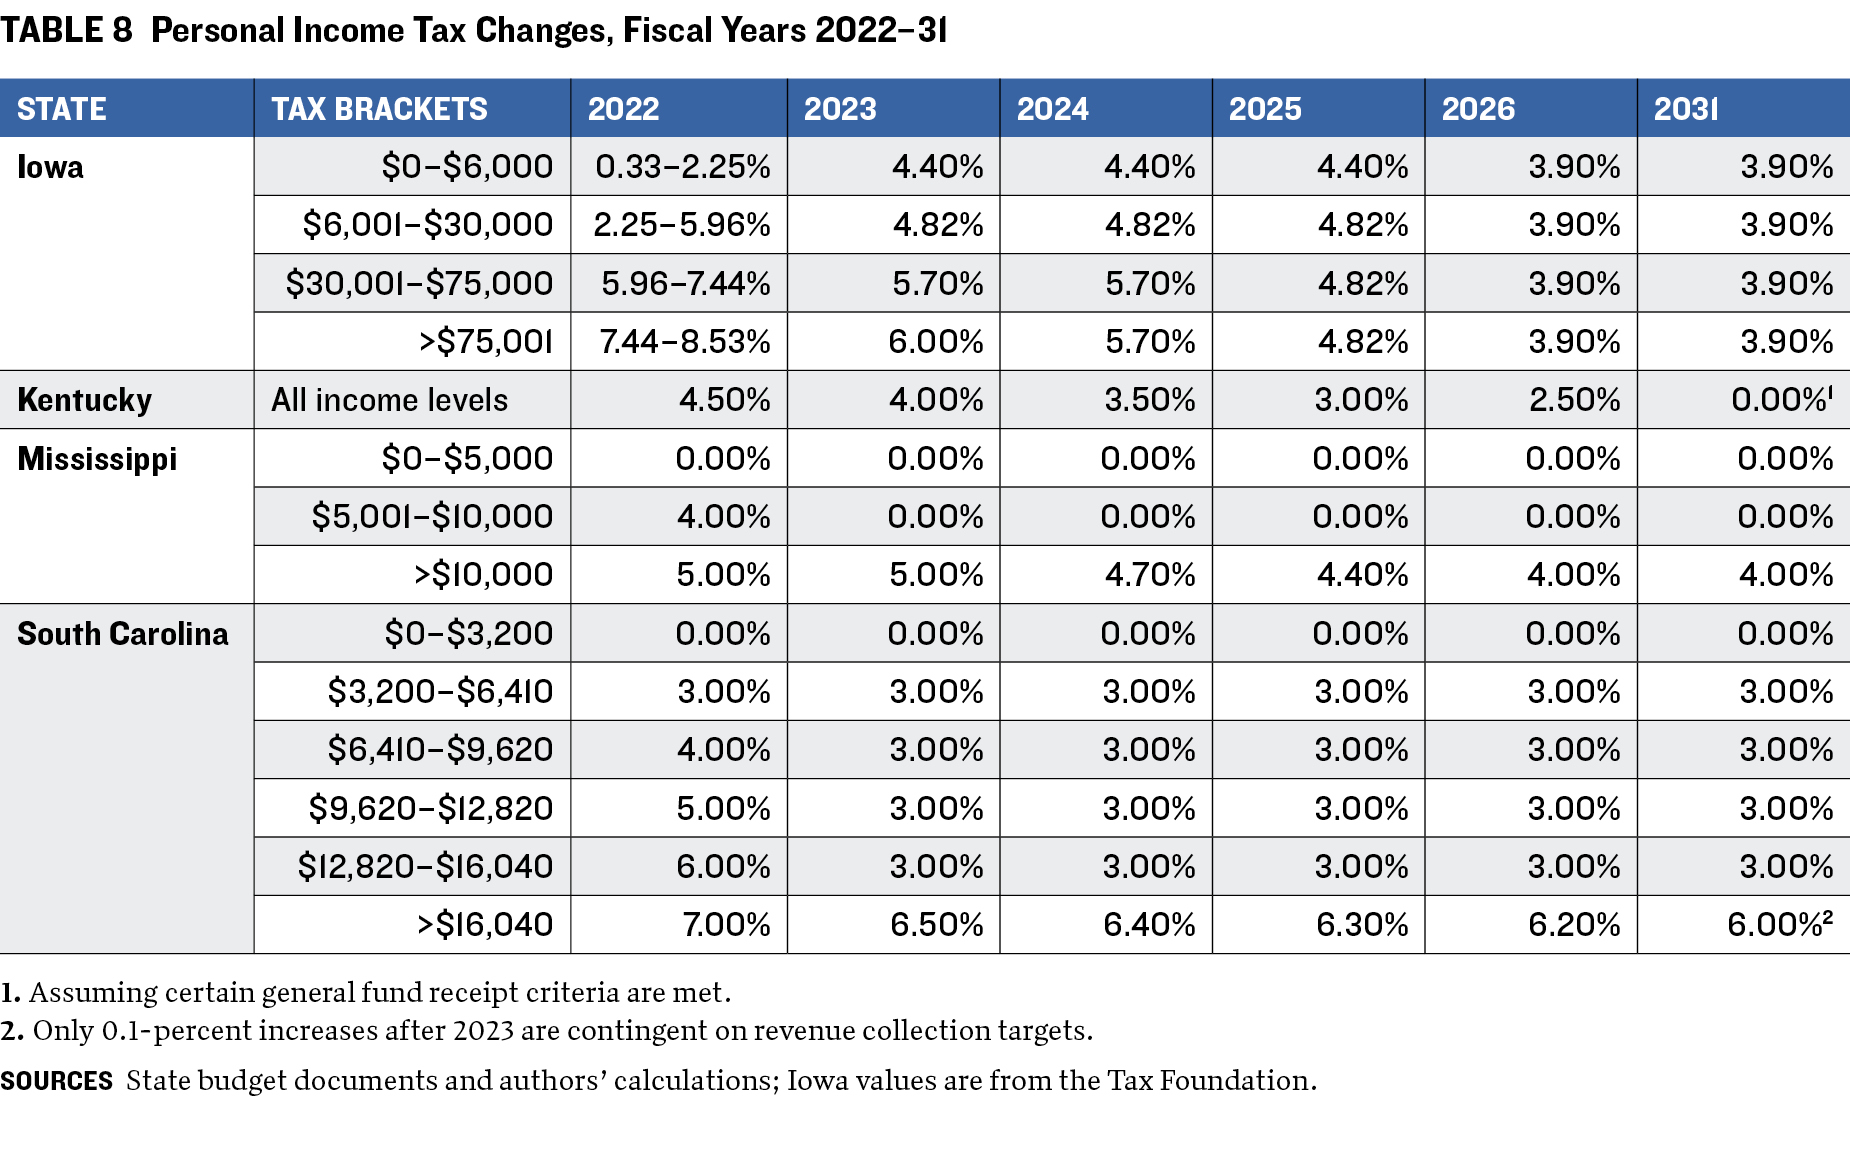
For example, revenues of $13.9 billion would allow for a 3.5 percent rate in 2024, while at $20.5 billion in revenues, the tax rate could fall to zero in 2031. Revenue reductions were estimated at $1.1 billion in fiscal 2023. Mississippi will lose $419.0 million by lowering its personal income tax rate 1 percentage point, to 4.0 percent, while reducing the portion of taxable income. Meanwhile, South Carolina was expected to forgo $611.0 million in fiscal 2023 by changing its structure for personal income tax from six tiers to three.
Among other states cutting personal income taxes, Utah reduced its flat rate by 0.10 percentage points, costing the state $78.5 million in revenues. In New York, rate cuts passed in 2016 were accelerated to begin in fiscal 2023 instead of 2025. These actions reduced the state’s tax rate to 5.5 percent from 5.9 percent for those earning $13,900–$80,650. It was cut to 6.0 percent from 6.3 percent for those earning $80,650–$215,400. Indiana enacted even larger percentage rate cuts—to 2.9 percent from just over 3.2 percent—at an estimated cumulative cost of about $942 million by 2030.
Corporate Income Tax
Iowa generated 3.6 percent of its total revenue from corporate income taxes in 2020, slightly above the 3.3 percent US average. But with one of the highest top corporate tax rates among states—12.0 percent—Iowa has embarked on a dramatic tax relief program. The top rate was cut to 9.8 percent for fiscal 2021, and in 2022 the state passed legislation to alter its corporate tax structure to a flat rate of 5.5 percent over several years. The amount of net corporate income tax received in a fiscal year will be measured against a base of $700 million; if it exceeds this, a new top tax rate will be calculated that would have yielded the base amount. As of 2023, this calculation yielded a percentage by which the top tax rate for the upcoming tax year will be lowered until all the tax brackets are flattened to a rate of 5.5 percent. According to a fiscal note for the 2022 law, the rate cut is projected to reduce net corporate income tax liabilities and general revenues by $19.6 million in 2023, rising to $229.4 million by 2028—equivalent to more than 25 percent of Iowa’s corporate income tax revenue collection in fiscal 2022.
To offset some of the revenue lost in the rate restructuring, Iowa also reduced the refundability of several business income tax credits by 5 percentage points each year for five years starting in fiscal 2023. Credits earmarked for such treatment include those for assistive devices, historic preservation, redevelopment, and research. The moves are projected to increase tax liabilities and state general fund revenue by $13.5 million in 2024 and up to $49.7 million by 2028.
Pennsylvania, which ranked forty-second in the State Business Tax Climate Index in 2023, also enacted a substantial reform plan. Before 2023, Pennsylvania had the second-highest US corporate tax rate, at 9.99 percent, and corporate taxes represented 4.3 percent of total state revenues in fiscal 2020. But after a decade of disagreement on a tax reform policy, in 2022 legislators approved a reduction in the corporate net income tax rate to 8.99 percent for fiscal 2023 and by another 0.5 percentage point annually until it reaches 4.99 percent, which is expected by 2031. The estimated revenue loss is $427.6 million over fiscal years 2023–24 alone.
Sales Tax
Florida was among a large number of states opting for sales tax breaks. The Sunshine State passed ten sales tax holidays in fiscal years 2022–23 for a variety of commonly purchased items, including fuel, diapers, disaster supplies, and tools. Among these were two fourteen-day tax holidays for back-to-school and disaster preparation supplies; two weeklong holidays for recreation and tools; a one-year exemption for children’s clothes, shoes, and diapers; and other temporary exemptions for energy-efficient appliances and children’s books. The estimated cost of these sales tax breaks for fiscal 2023 was $498 million.
In contrast, Kansas went for permanent sales tax breaks to help lower-income households. Beginning in January 2023, the sales and use tax rate on food and food ingredients was reduced to 4.0 percent from 6.5 percent as part of a plan to eliminate taxes in this category altogether. The state intends to further reduce the rate to 2.0 percent in January 2024 and abolish it completely the next year, at a total estimated cost of $1.3 billion in fiscal years 2023–26.
2. PAYING FOR TAX CUTS: Where States Earn Their Revenues
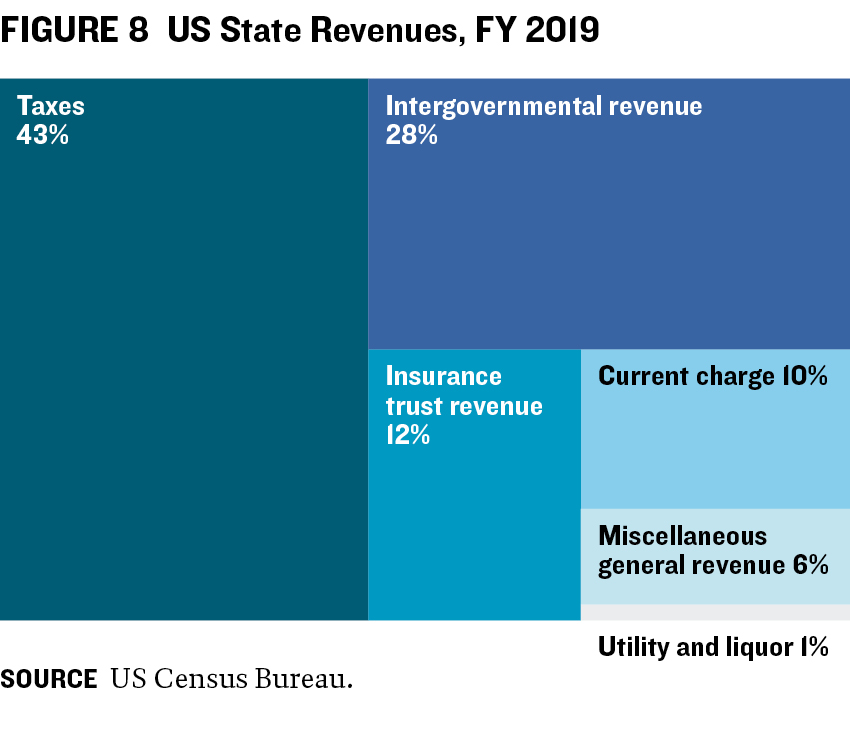
To put recent tax policy changes in context, we present the structure of state revenues and how these resources are spent. States collected about $2.7 trillion in total revenues in fiscal 2019, before the pandemic, according to the US Census Bureau. As shown in figure 8, 43 percent of all revenues came from taxes—the single largest source of revenue for states. Other key sources included intergovernmental revenue and insurance trust fund revenues, which made up 28 percent and 12 percent of total revenues, respectively. All revenues received from other governments (monetary aid, shared revenues, or reimbursements for performance) are classified as intergovernmental revenues, while insurance trust fund revenue consists of support from employee and employer income contributions to finance social programs.28 States also received about 9 percent of their revenues from current charges and a further 6 percent from miscellaneous general revenues, such as interest earnings and lottery.29 The remaining 1 percent is primarily liquor and utility revenues.
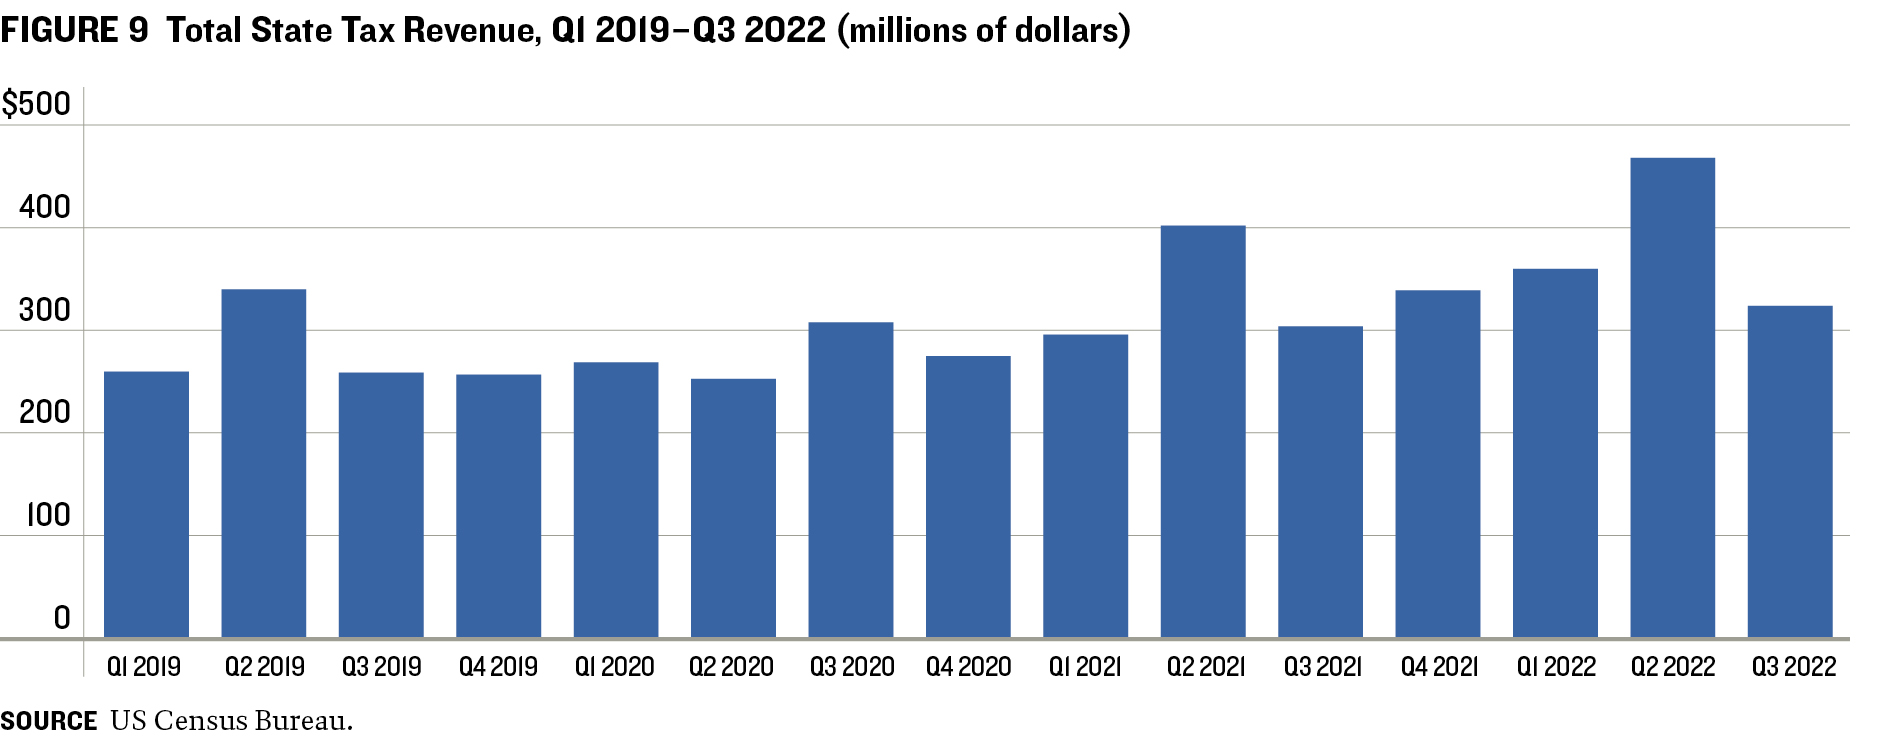
 We can analyze how tax revenues have changed in recent years. Figure 9 shows that they follow a cyclical pattern, with revenue increasing around the second quarter of the year, when most tax filing deadlines occur. The exception in this time frame is 2020, when revenues peaked in the third quarter because of the extended tax filing deadlines in response to the COVID-19 pandemic. Nevertheless, the cyclical annual peak of 2020 is significantly lower than that of 2019 and of subsequent years: Quarterly tax revenue peaked at $339 billion in 2019 and fell 10 percent in 2020, to $307 billion. Revenues rebounded quickly in 2021, however, with a second-quarter tax revenue peak of $401 billion—18 percent higher than the 2019 peak and 31 percent higher than that of 2020. Tax revenues continued to grow in 2022 and surpassed the 2021 peak by $66 billion, 38 percent and 52 percent higher than 2019 and 2020, respectively. These trends suggest that though revenues were negatively affected in the first year of the pandemic, they exceeded prepandemic levels within a year as federal aid started to flow and the economy revived.
Although the quarterly trend analysis shows that the pandemic had a limited and short-lived impact on state tax revenues, the disruptions it caused to everyday life may have led to varying effects on different sources of tax revenues.
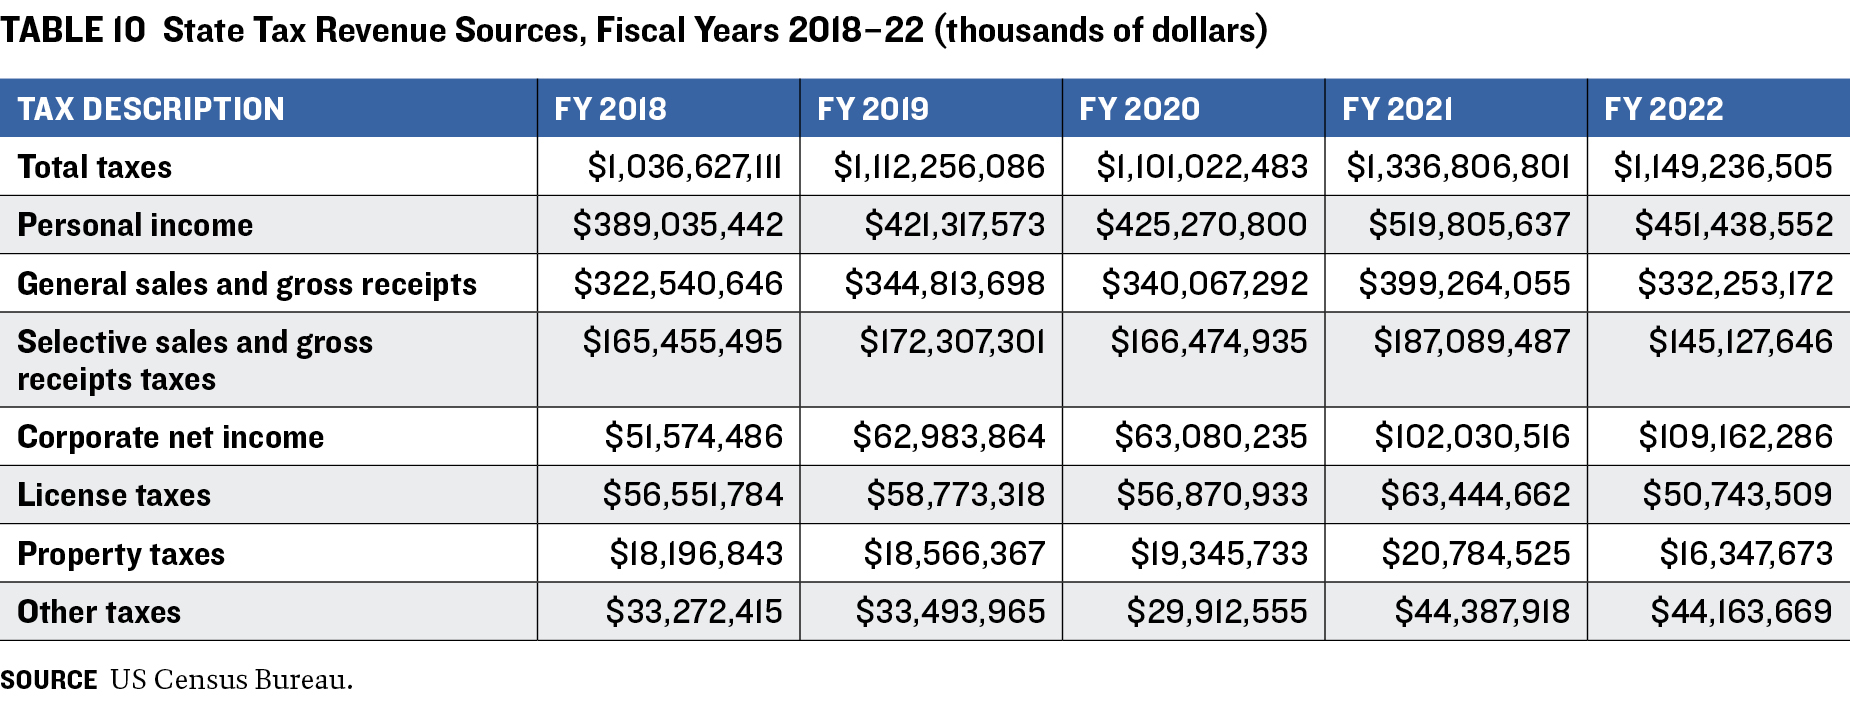
Table 9 below shows the portion of tax revenues from various sources in fiscal years 2018–22.30 State tax collections in the years considered exceeded a total of $1 trillion; the main sources of tax revenues—personal income, general sales, and selective sales levies—accounted for over 80 percent of tax revenues in those years (table 10). General sales tax includes revenues from the regular sale of most goods and services, while selective sales taxes include those from targeted commodities or services, such as alcoholic beverages and tobacco products, insurance, and motor fuel. States collected about 10 percent of their tax revenues from corporate net income in fiscal 2022, up from 5.7 percent in 2019–2020 and 7.6 percent in 2021. This increase was offset by a decline in the portion of tax revenues from selective sales taxes, to just under 13 percent in fiscal 2020 from about 16 percent in 2019.
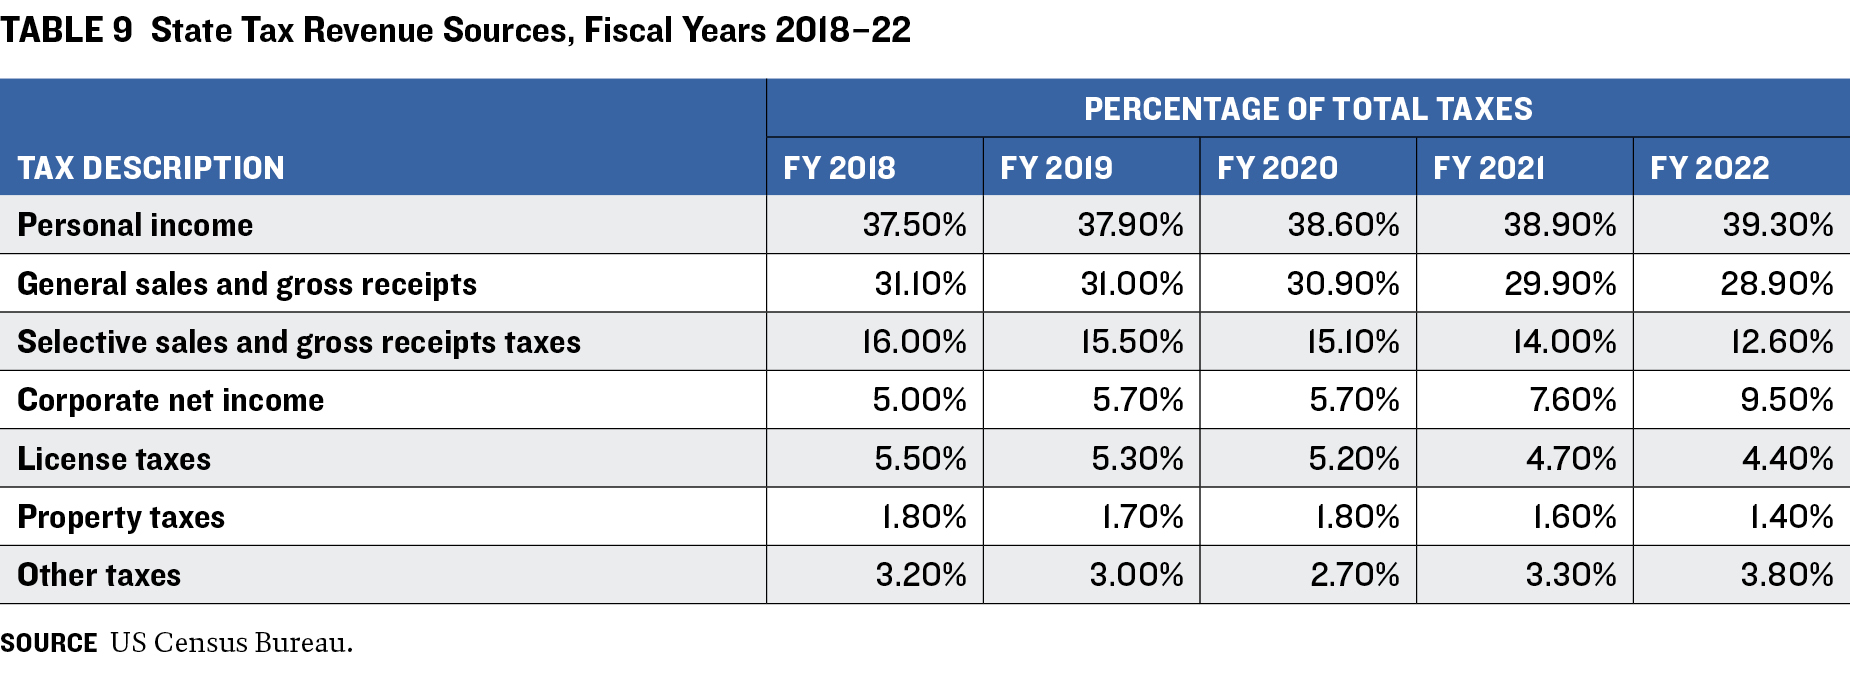
 The remainder of tax revenues came from license, property, and other taxes, which made up no more than 10 percent of revenues in fiscal years 2018–22. As such, although states seem to have relied more on corporate net income revenues since fiscal 2020, the distribution of the main sources of tax revenues has remained stable.
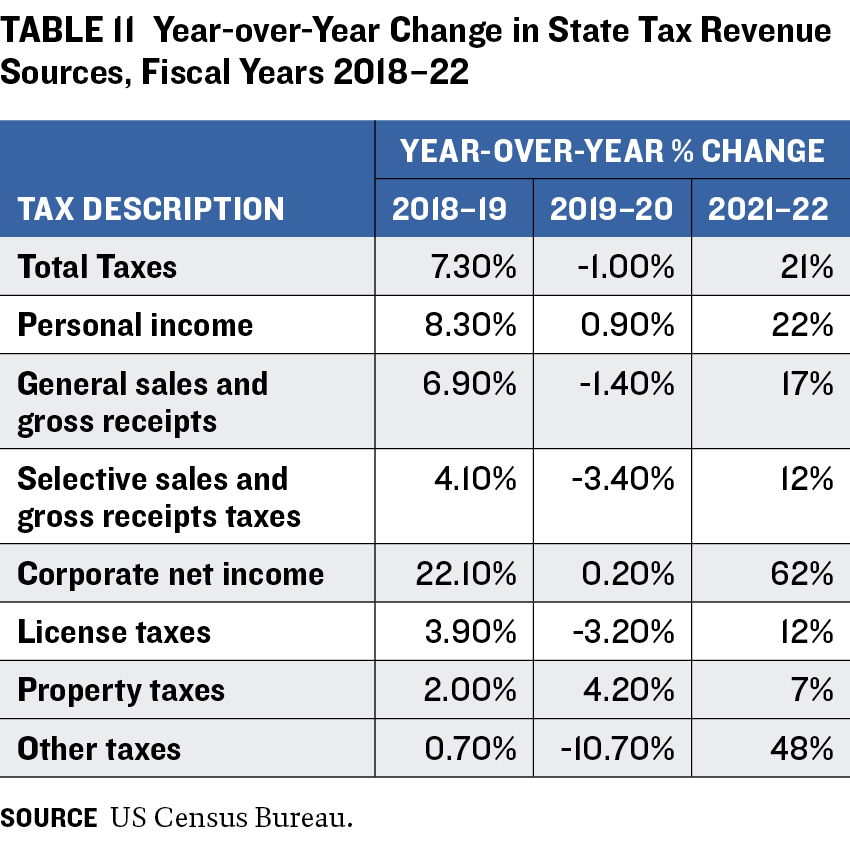
As illustrated in table 11, all tax revenue sources from fiscal years 2018–19 show growth, while the year-over-year changes in 2019–20 showed little growth or declines, as would be expected during the pandemic. Revenue in fiscal years 2021–22 rebounded well. Total taxes grew 7.3 percent in 2018–19, declined 1.0 percent in 2019–20, then grew 21.0 percent in 2021–22. During the first year of the pandemic, personal and corporate income and property taxes proved the most stable tax revenue sources and were the only ones to show year-over-year growth in 2019–20.
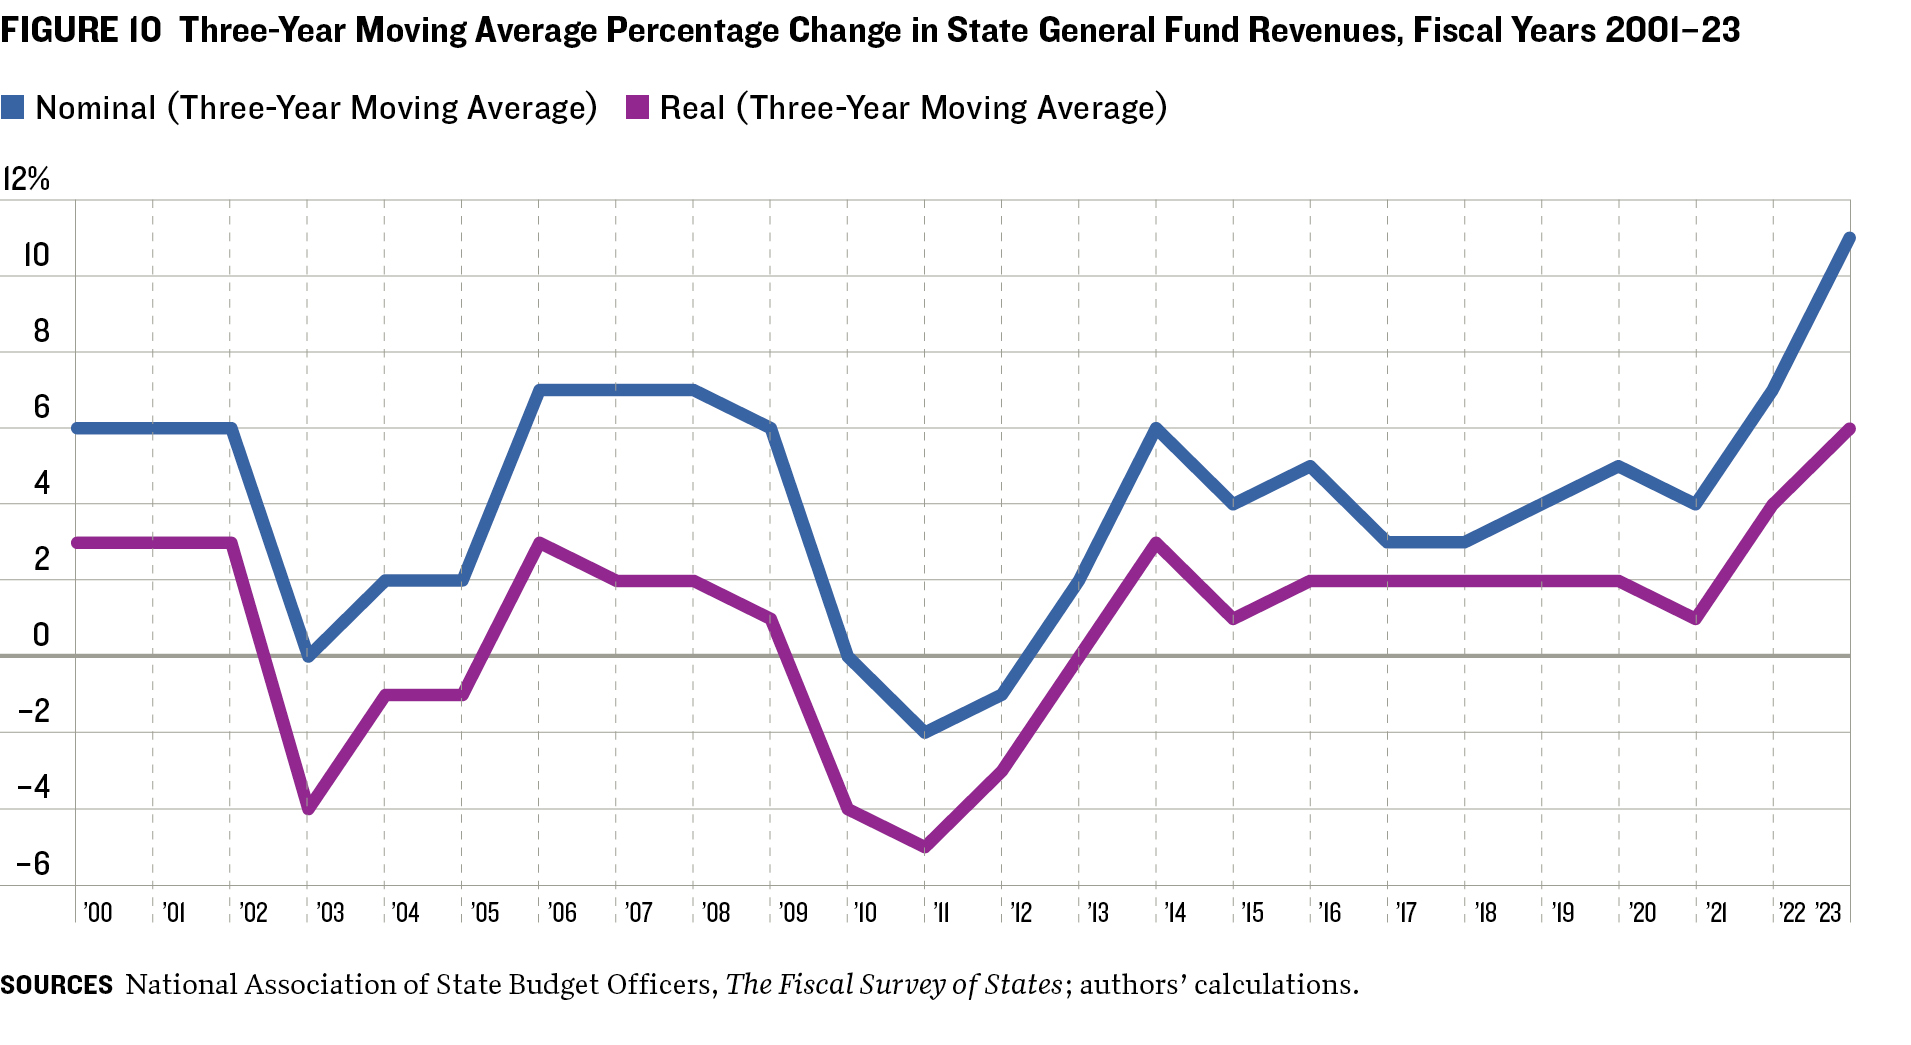
 As illustrated in figure 10, the three-year moving average shows a consistent rise in general fund revenues during and after the pandemic. In fiscal 2022, state general fund revenues grew 19.0 percent, to $1.21 trillion. According to preliminary actual budget data for fiscal 2023, those revenues were projected to rise 0.9 percent.31
3. HOW STATES SPEND THEIR REVENUE
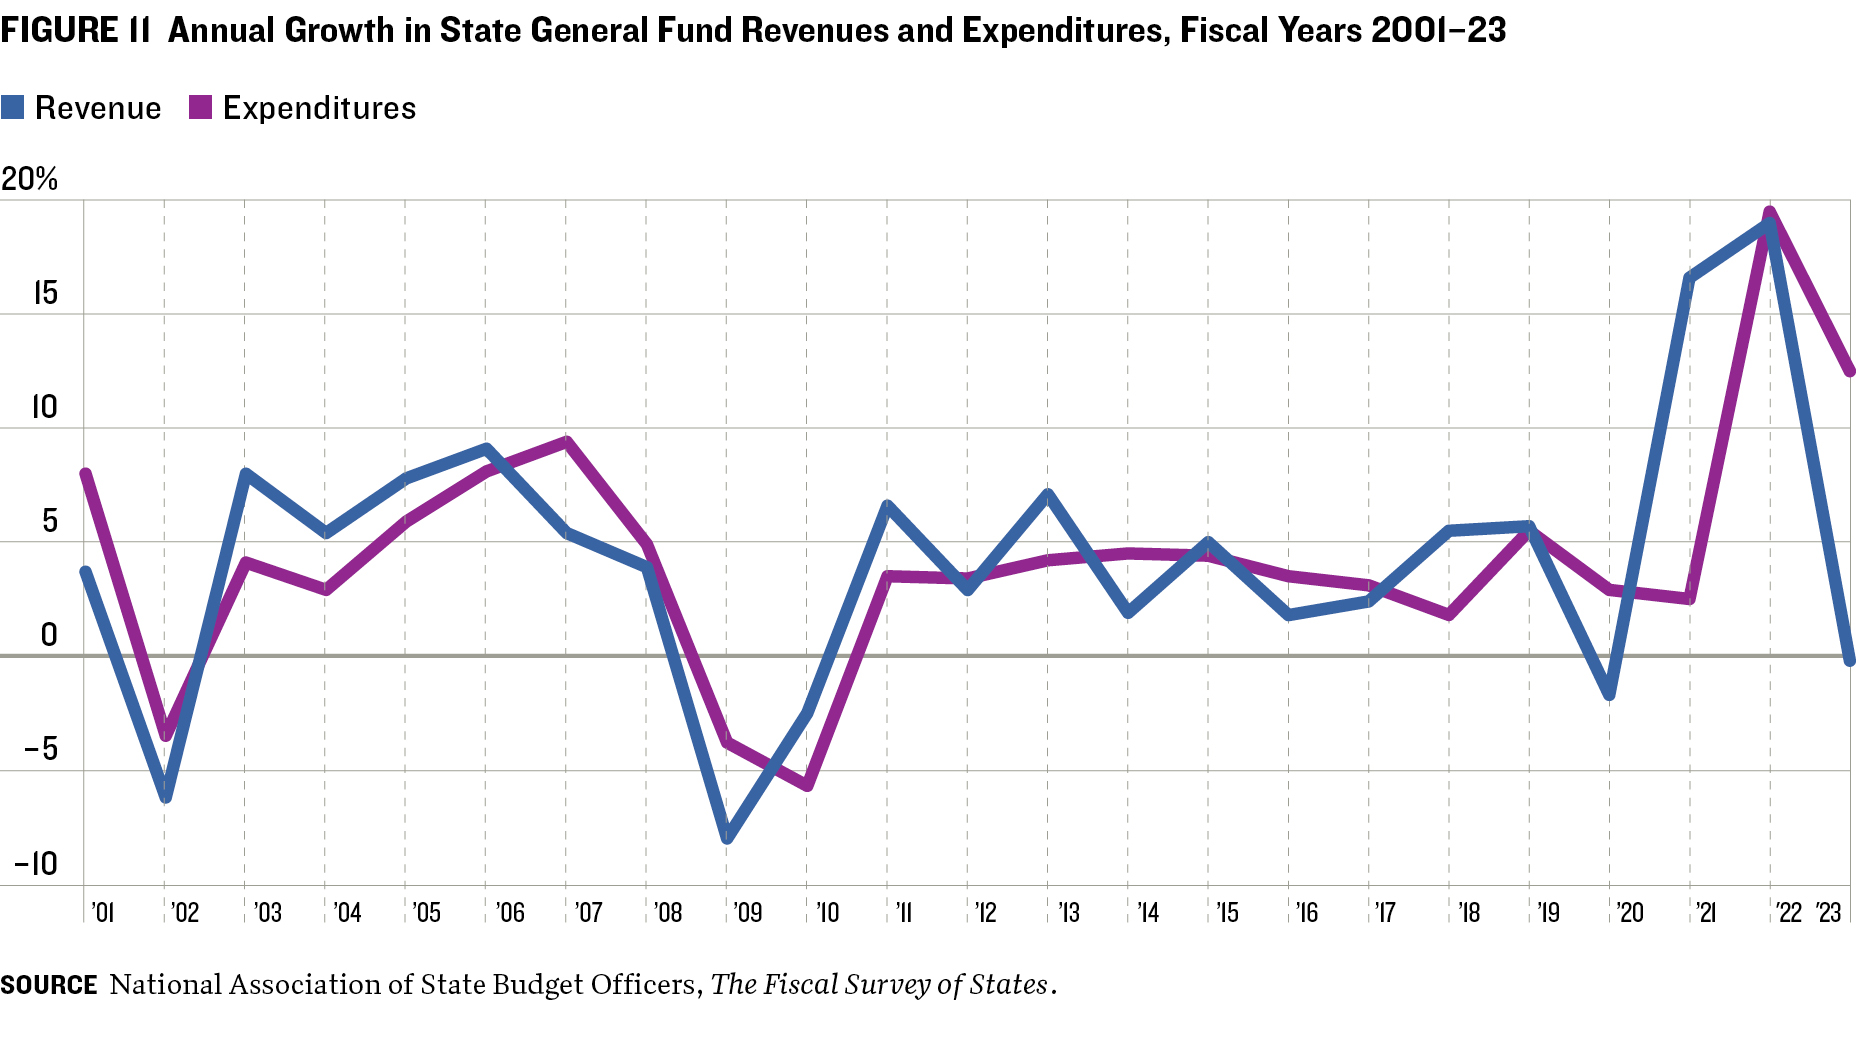
Because states must produce balanced budgets—either by statute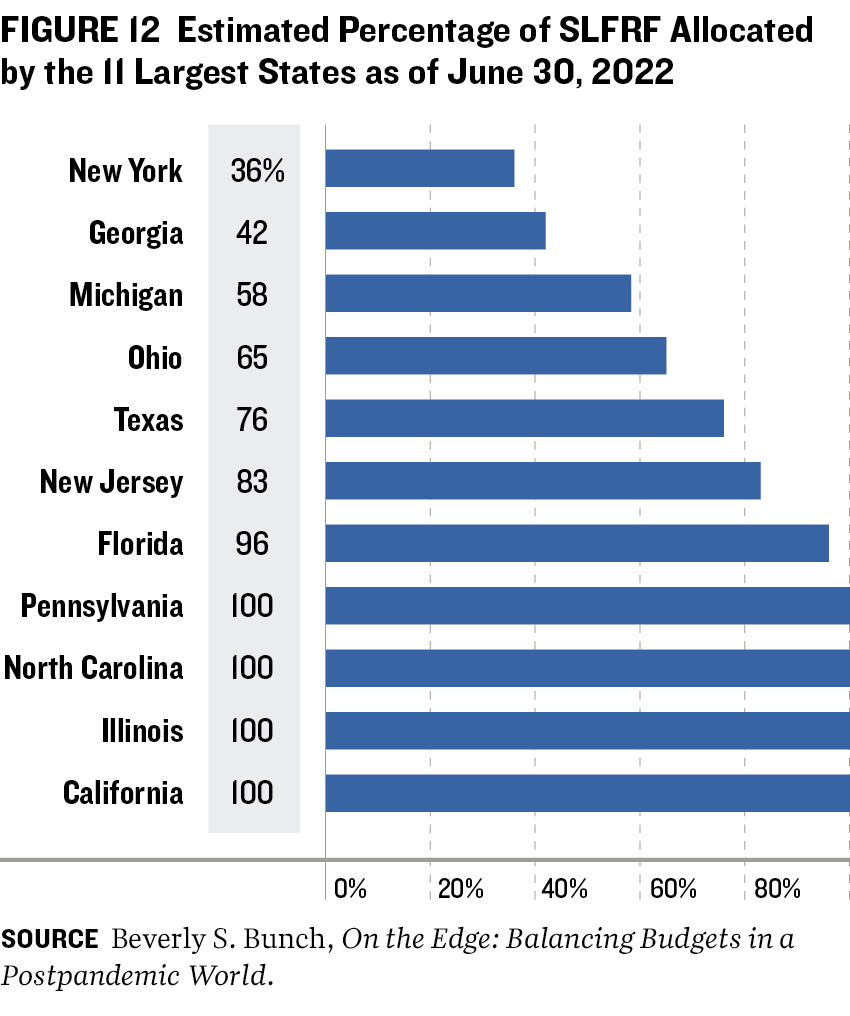 or longstanding tradition—spending growth largely mirrors revenue growth. Record increases in general fund revenues and federal COVID-19 relief assistance resulted in expenditures from these funds increasing sharply in fiscal years 2021–23 (figure 11). They grew 2.5 percent in fiscal 2021, to $915.2 billion; 19.5 percent in 2022, to $1.1 trillion; and 12.5 percent in 2023, to $1.2 trillion.
The Coronavirus State and Local Fiscal Recovery Funds (SLFRF) program, created under the American Rescue Plan, has distributed $195 billion to states. As of August 31, 2022, they had assigned $157 billion (79 percent) of the total recovery funds appropriated.32 In On the Edge: Balancing Budgets in a Postpandemic World, Beverly Bunch found that revenue replacement accounted for the largest single portion (43 percent) as of July 31, 2022.33
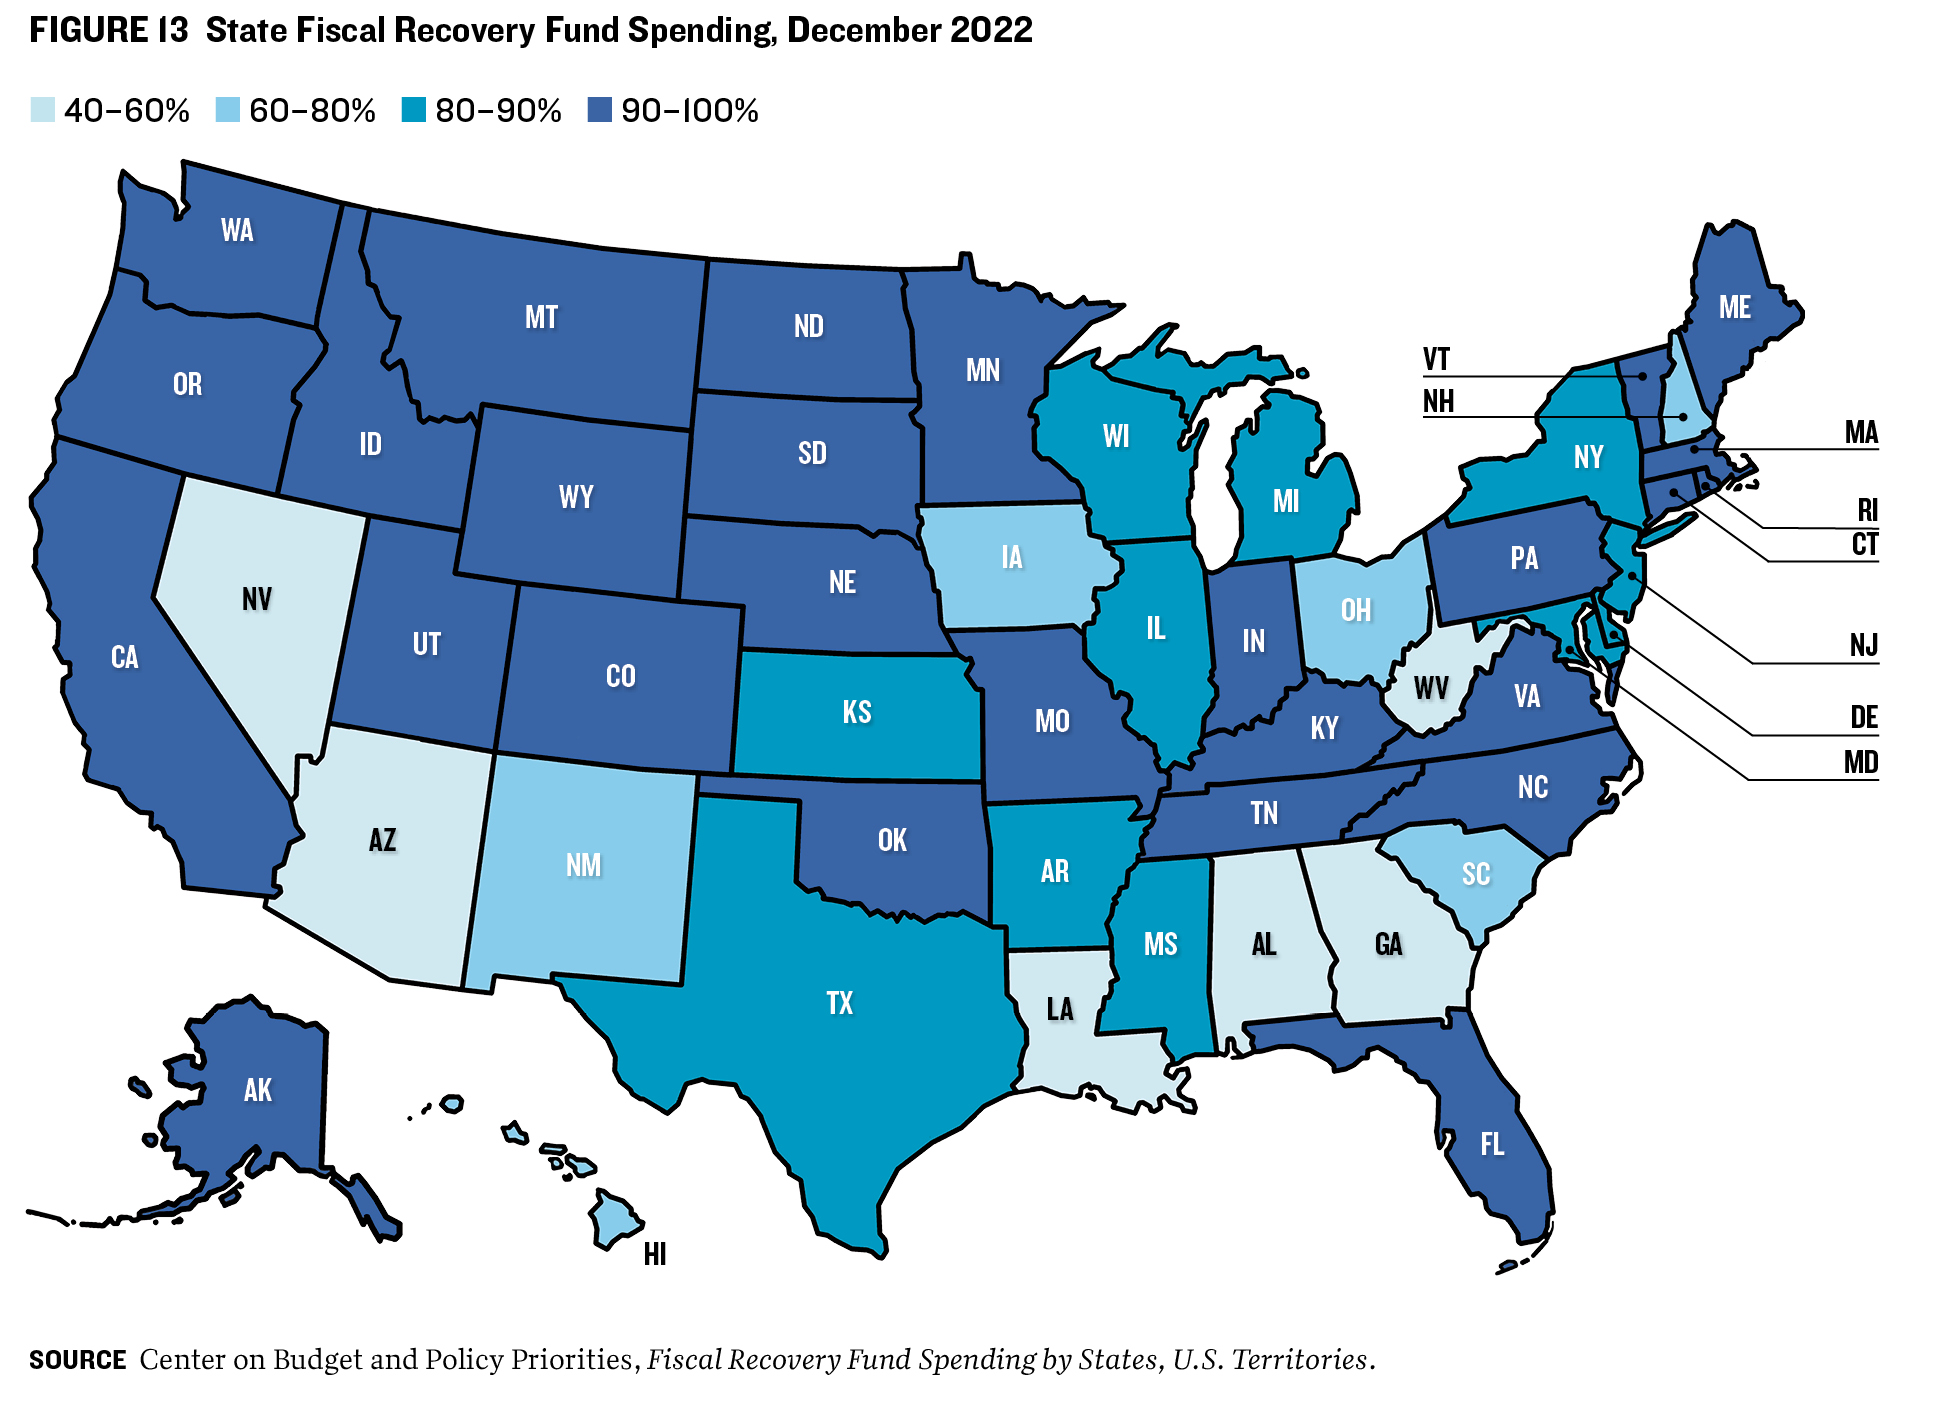
Figure 12 details the spending of the 11 largest US states; figure 13 gives a broader view of spending by other states.34 Utilizing one-time revenues such as SLFRF dollars for one-time expenditures rather than ongoing expenses is critical to helping states avoid potential fiscal cliffs once that aid runs out.
4. RAINY DAY FUNDS AND SURPLUSES
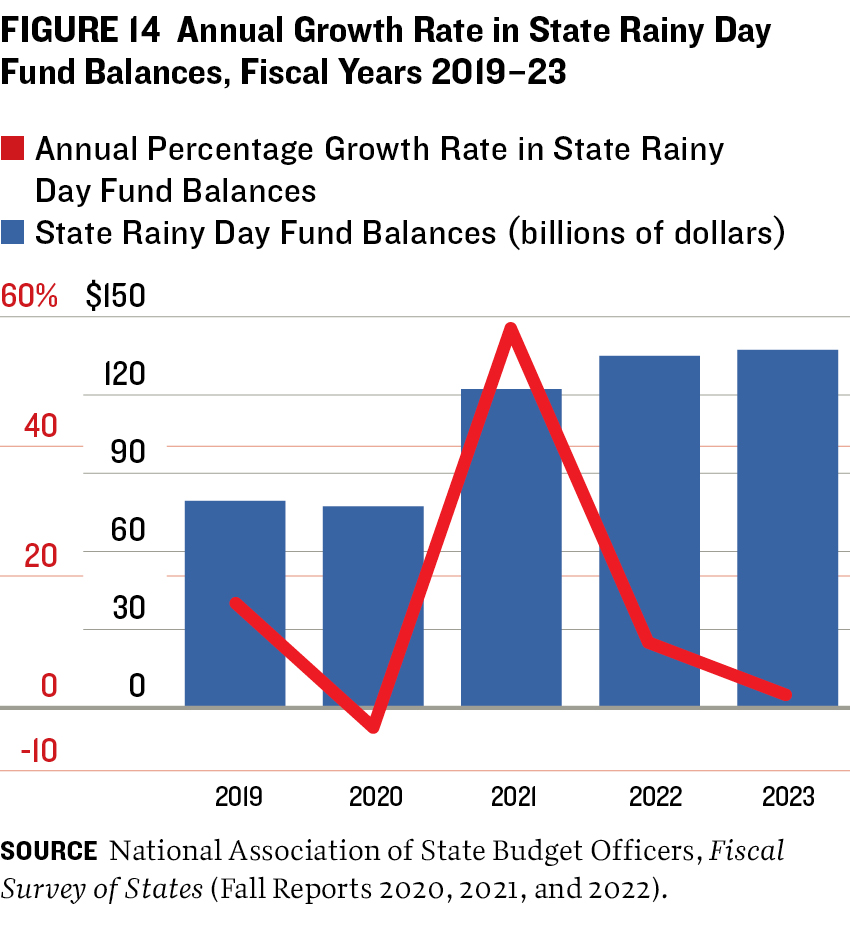 Reserve funds are the safety valve of state budgeting, used to offset the impact of economic contractions and natural disasters. Besides general funds, reserve funds are one of the primary sources for states. Before the pandemic, state rainy day fund balances were at an all-time high, reaching $79 billion after a decade of rebuilding after the Great Recession (figure 14). In fiscal 2020, however, unexpected budget gaps made states turn to their rainy day funds to close pandemic-induced shortfalls. Although states recorded a decline in rainy day fund balances that year, they saw a 59 percent surge in 2021, to $121.8 billion, due to stronger-than-anticipated revenue growth. NASBO forecast that rainy day funds would grow further, to $134.5 billion in 2022 and $136.8 billion in 2023.
Total Balances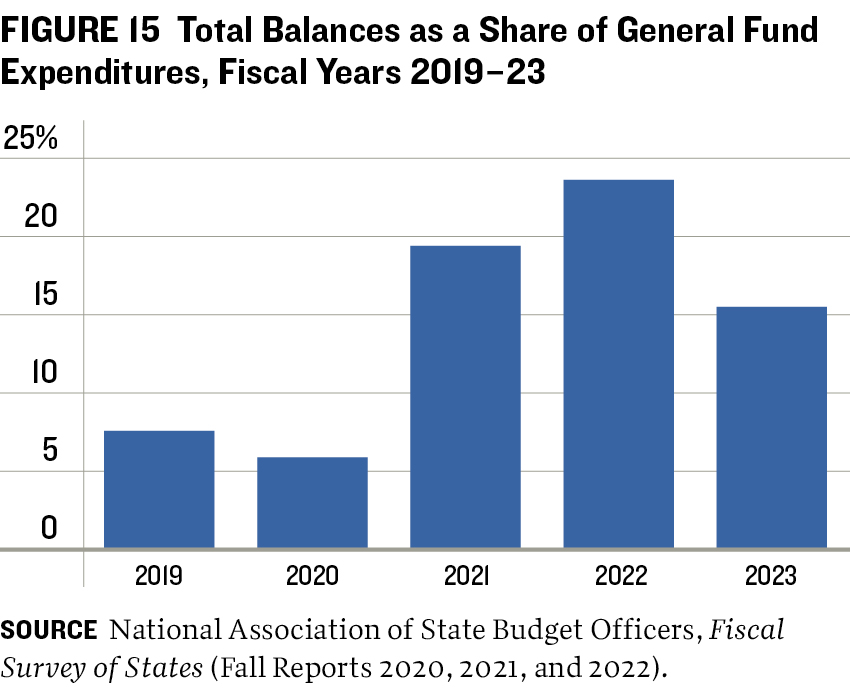
Total balance levels (state rainy day fund balances plus general fund ending balances) reached a record high in fiscal 2019 (figure 15). Total balances came to $121.6 billion, or for 7.6 percent of state general fund expenditures. As states dealt with the early impacts of the pandemic, total balances declined to $111.2 billion in 2020. But unanticipated revenue growth and federal assistance helped them grow by a record 237 percent in 2021, to $217.1 billion.
Total balance levels continued to rise in fiscal 2022, reaching $342.9 billion—23.6 percent of state general expenditures. According to enacted state budgets for 2023, total balance levels were projected to experience a drop of 18.0 percent, to $280.1 billion, or 15.5 percent of state general fund spending. The forecast was driven largely by states’ plans to spend a portion of those balances.
Sustaining Healthy Reserve Funds
In order to maintain sufficient reserve funds over the long term, states should adopt and follow these policies recommended by the Volcker Alliance:
RESERVE FUNDS DISBURSEMENT Without a clear policy governing the use of reserves, they can turn into slush funds to be spent at legislators’ whim. States should have policies governing when and how reserves can be tapped for natural disasters and when the economy slumps, tax revenues drop, and rising unemployment creates higher demand for state services.
RESERVE FUNDS REPLENISHMENT If rainy day funds are used to help deal with emergencies, unexpected expenses, or revenue shortfalls, states need to follow guidelines to ensure that the cash is replaced. Without replenishment policies, states risk facing the next economic downturn with minimal financial cushion to help sustain operations.
RESERVES TIED TO REVENUE VOLATILITY States with less volatile revenues can sensibly establish smaller reserves than those in which revenue fluctuations are more frequent and more dramatic.
ACKNOWLEDGMENTS
THIS REPORT WAS MADE POSSIBLE in part by a grant from the Peter G. Peterson Foundation. The statements made and views expressed are solely the responsibility of the authors. We acknowledge the considerable support provided by the late Paul A. Volcker, the Volcker Alliance’s founding chairman, as well as the numerous academics, government officials, and public finance professionals who have guided the Alliance’s research on state budgets for the last seven years. We are also grateful for the constant support and guidance of the late Richard Ravitch, the former New York State lieutenant governor and founding Alliance board member, who died in June 2023.
As part of the Volcker Alliance series State and Local Budgeting in the COVID Era, this issue paper builds on the research into state expenditures by Beverly S. Bunch, professor in the School of Public Management and Policy at the University of Illinois Springfield, and author of the Alliance reports The $195 Billion Challenge: Facing State Fiscal Cliffs after COVID-19 Aid Expires (2022) and On the Edge: Balancing Budgets in a Postpandemic World (2023). The authors of this paper also acknowledge their debt to previous research efforts between the Alliance and several universities, including the Andrew Young School of Policy Studies at Georgia State University, on the Truth and Integrity in State Budgeting report series (2015–21).
The authors would also like to thank Victoria Burgos and Qurrat-ul-Ain Rasheed for their assistance and support of the research team.
ENDNOTES
1. Wesley Tharpe, States’ Recent Tax-Cut Spree Creates Big Risks for Families and Communities, Center on Budget and Policy Priorities, Nov. 30,
2023, https://www.cbpp.org/research/state-budget-and-tax/states-recent-tax-cu….
2. USASpending.gov, The Federal Response to COVID-19, data through Sept. 30, 2023, https://www.usaspending.gov/disaster/covid-19.
3. National Association of State Budget Officers, Summary: Fall 2022 Fiscal Survey of States, Dec. 16, 2022, https://higherlogicdownload.
s3.amazonaws.com/NASBO/9d2d2db1-c943-4f1b-b750-0fca152d64c2/UploadedImages/Issue%20Briefs%20/Fall_2022_Fiscal_Survey_
Summary.pdf.
4. Tharpe, States’ Recent Tax-Cut Spree Creates Big Risks for Families and Communities.
5. Authors’ calculations from US Census Bureau, State and Local Government Finances by Level of Government and by State: 2021, https://
www.census.gov/data/tables/2021/econ/state/historical-tables.html.
6. In January 2023, the US Court of Appeals for the Eleventh Circuit ruled in a lawsuit filed by thirteen states that a provision in the American
Rescue Plan Act prohibiting states from using ARPA funds “to either directly or indirectly offset a reduction in [their] net tax revenue” was
unconstitutional. In February 2024, the US Treasury declined to appeal the ruling to the Supreme Court. See Appeal from the United States
District Court for the Northern District of Alabama, D.C. Docket No. 7:21-cv-00465-LSC, https://media.ca11.uscourts.gov/opinions/pub/
files/202210168.pdf, and Connor Hussey, “Biden Administration Won’t Take ARPA Tax Cut Case to Supreme Court,” Bond Buyer, Feb. 2, 2024,
https://www.bondbuyer.com/news/biden-administration-wont-take-arpa-tax-….
7. Jared Walczak, Designing Tax Triggers: Lessons from the States, Tax Foundation, Sept. 7, 2016, taxfoundation.org/research/all/state/
designing-tax-triggers-lessons-states.
8. Wesley Tharpe, “Growing Trend to Phase in or Trigger State Tax Cuts Is Irresponsible, Skirts Accountability,” Center on Budget and Policy
Priorities, March 8, 2023, www.cbpp.org/blog/growing-trend-to-phase-in-or-trigger-state-tax-cuts-i….
9. Kristen Eskow, “Indiana Lawmakers Accelerate Income Tax Cut,” Fox 59, May 22, 2023, fox59.com/indianapolitics/indiana-lawmakersaccelerate-
income-tax-cut.
10. Institute of Taxation and Economic Policy, “Which States Have Tax Cut Triggers or Phase-Ins?” March 7, 2023, itep.org/which-stateshave-
tax-cut-triggers-or-phase-ins.
11. Tharpe, “Growing Trend to Phase in or Trigger State Tax Cuts Is Irresponsible, Skirts Accountability.”
12. Forty-three states levy personal income taxes, and forty-one tax wages and salary income. New Hampshire exclusively taxes dividend and
interest income, while Washington taxes only capital gains income. Seven states levy no personal income tax.
13. Under H.B. 30, for tax year 2022 the standard deduction increases from $4,500 to $8,000 for single filers and from $9,000 to $16,000 for
married filers filing jointly if state annual revenue growth is at least 5% for the six months of July through December 2022. For tax year 2023,
the increase in the standard deduction is contingent on annual revenue growth of at least 5 percent for the 12 months ending June 2023. If the
5 percent growth rate is not met for either taxable year, the standard deduction for that year will be $7,500 for single filers and $15,000 for
married filers. The increase in the standard deduction is scheduled to sunset after tax year 2025, when it will revert to the standard deduction
amounts that applied before tax year 2019—$3,000 for single filers and $6,000 for married couples filing jointly. https://taxnews.ey.com/
news/2022-1509-virginia-revised-income-tax-withholding-tables-and-formulas-apply-for-wages-paid-on-and-after-october-1-2022.
14. Adam Hoffer and Jessica Dobrinsky-Harris, “How High Are Gas Taxes in Your State,” Tax Foundation, Aug. 15, 2023, https://taxfoundation.
org/data/all/state/state-gas-tax-rates-2023/.
15. Russ Bynum, “Kemp Extends Gas Tax Suspension through Holiday Season,” Fox54, Dec. 8, 2022, www.wfxg.com/story/47899546/kempextends-
gas-tax-suspension-through-holiday-season.
16. US Census Bureau, 2021 State & Local Government Finance Historical Datasets and Tables, https://www.census.gov/data/datasets/2021/
econ/local/public-use-datasets.html.
17. National Association of State Budget Officers, The Fiscal Survey of States, Fall 2023, ix, https://higherlogicdownload.s3.amazonaws.com/
NASBO/9d2d2db1-c943-4f1b-b750-0fca152d64c2/UploadedImages/Fiscal%20Survey/NASBO_Fall_2023_Fiscal_Survey_of_States_S.pdf.
18. National Association of State Budget Officers, The Fiscal Survey of States, Fall 2022, https://higherlogicdownload.s3.amazonaws.com/
NASBO/9d2d2db1-c943-4f1b-b750-0fca152d64c2/UploadedImages/Fiscal%20Survey/NASBO_Fall_2022_Fiscal_Survey_of_States_S.pdf.
19. North Carolina’s phase-in stems from S.B. 105, adopted November 2021.
20. Georgia H.B. 1437, www.legis.ga.gov/api/legislation/document/20212022/212207.
21. David Pitt, “Iowa Governor Backs $2B Tax Cut with Changes to Income Tax Rates,” KTVO, Jan. 12, 2021, ktvo.com/news/local/iowagovernor-
backs-2b-tax-cut-with-changes-to-income-tax-rates.
22. Casey Quinlan, “States Criticized for Spending Federal Relief Funds on Tax Cuts, Prisons,” Iowa Capital Dispatch, Feb. 5, 2023,
iowacapitaldispatch.com/2023/02/05/states-criticized-for-spending-federal-relief-funds-on-tax-cuts-prisons.
23. AZ Family News Staff and the Associated Press, “Gov. Ducey Orders Historic Tax Cut to Take Effect in 2023,” Sept. 29, 2022, www.azfamily.
com/2022/09/29/gov-ducey-orders-historic-tax-cut-take-effect-2023.
24. “American Rescue Plan Factsheet,” March 2021, www.whitehouse.gov/wp-content/uploads/2021/03/American-Rescue-Plan-Fact….
pdf.
25. California Office of the Governor, “Governor Newsom, Senate President pro Tempore Atkins and Assembly Speaker Rendon Announce
Budget Agreement,” June 26, 2022, www.gov.ca.gov/2022/06/26/governor-newsom-senate-president-pro-tempore-…-
rendon-announce-budget-agreement.
26. Legislature of the State of Idaho, H.B. 436, https://legislature.idaho.gov/wp-content/uploads/sessioninfo/2022/legis….
27. Iowa Legislative Services Agency, HF 2317—Income Tax Rate Reduction and Exemptions, www.legis.iowa.gov/docs/publications/
FN/1292087.pdf.
28. US Census Bureau, 2019 Annual Survey of State Government Finances Tables, https://www.census.gov/data/tables/2019/econ/state/
historical-tables.html.
29. Peter Bluestone, Current Charges and Miscellaneous General Revenue: A Comparative Analysis of Georgia and Selected States, Fiscal
Research Center, Andrew Young School of Policy Studies, Dec. 2009, www.issuelab.org/resources/4216/4216.pdf.
30. 2022 excludes information from the final quarter, which is not available as of this writing. Fiscal 2018 is included to provide fiscal 2019
year-over-year values.
31. National Association of State Budget Officers, The Fiscal Survey of States, Fall 2023, 43, https://higherlogicdownload.s3.amazonaws.com/
NASBO/9d2d2db1-c943-4f1b-b750-0fca152d64c2/UploadedImages/Fiscal%20Survey/NASBO_Fall_2023_Fiscal_Survey_of_States_S.pdf.
32. Iris Hinh, “How States Can Best Use Federal Fiscal Recovery Funds: Lessons from State Choices So Far,” Center on Budget and Policy
Priorities, Jan. 18, 2023, www.cbpp.org/research/state-budget-and-tax/how-states-can-best-use-fede….
33. Beverly Bunch, On the Edge: Balancing Budgets in a Postpandemic World, Volcker Alliance, September 2023.
34. Center on Budget and Policy Priorities, “Fiscal Recovery Fund Spending by States, U.S. Territories,” www.cbpp.org/research/state-budgetand-
tax/resource-lists/fiscal-recovery-funds-in-the-american-rescue-plan.
© 2024 VOLCKER ALLIANCE INC.
Published February, 2024
The Volcker Alliance Inc. hereby grants a worldwide, royalty-free, non-sublicensable, non-exclusive license to download and distribute the Volcker Alliance paper titled State Tax Cuts After the Pandemic: Strategies to Sustain Fiscal Health (the “Paper”) for non-commercial purposes only, provided that the Paper’s copyright notice and this legend are included on all copies.
This paper was published by the Volcker Alliance as part of its Truth and Integrity in Government Finance Initiative. The views expressed in this paper are those of the authors and do not necessarily reflect the position of the Volcker Alliance. Any errors or omissions are the responsibility of the authors.
Don Besom, art director; Michele Arboit, copy editor.


