New York: State of Debt

A Comparison with Other Major Borrowers
Executive Summary
In the Volcker Alliance's evaluation of five budgetary categories for fiscal 2015 through 2019, New York was one of only four of the fifty states to receive a D average—the second-lowest grade possible—in Budget Maneuvers, one of five categories in which states are evaluated. The mark reflected the state’s use of one-time measures to offset continuing expenditures and achieve nominal budget balance.1 The state deployed this potentially unsustainable technique even as the longest national economic recovery in more than a century2 buoyed tax revenues in the study period’s final two years.3 Another budget maneuver New York used frequently during the period was funding recurring expenditures with nonbonded debt.4 In addition, its relatively uncommon practice of delivering many services through numerous independent public authorities that issue bonds helped make the state’s debt structure more complex than that of most other states. In this study, we compare New York’s system of borrowing with that of four other states—California, Florida, Michigan, and New Jersey—with each of those representing an archetype of traditional state debt practices. We present examples of practices by the other states that New York may want to adopt, and we advance a general set of reforms for the state to follow.
Introduction
In fiscal 2015 through 2019, the five years covered by the Volcker Alliance in Truth and Integrity in State Budgeting: Preparing for the Storm, New York was one of only four states to receive a D average, the second-lowest grade possible, in the Budget Maneuvers category for its widespread use of one-time measures to balance its budgets.5 The report noted repeated revenue and cost shifts between related entities, as well as funding of recurring expenditures with nonbonded debt, asset sales, or upfront revenues earned from financial transactions.6 New York’s debts at the end of the study period included tens of billions of dollars in unfunded liabilities for other postemployment benefits (OPEB) for public workers, principally health care, which the state funds on a pay-as-you go basis rather than building reserves—as it has with pensions—to offset these long-term obligations.7
The OPEB liability is just one element of New York’s highly complex debt structure, which also features a decentralized system of accessing capital markets. Such decentralization facilitates continual skirting of state constitutional and statutory debt limits—including a waiver of such restrictions enacted by the legislature in 2020 and again in 2021 in response to the COVID-19 pandemic.8 Maneuvering around debt limits permits a reliance on one-off budget solutions or excess leverage while reducing transparency for stakeholders inside and outside government. The maneuvering has persisted after major debt and authority reform initiatives and consolidation of most of New York’s core borrowing programs into securities backed by personal income and sales taxes.9
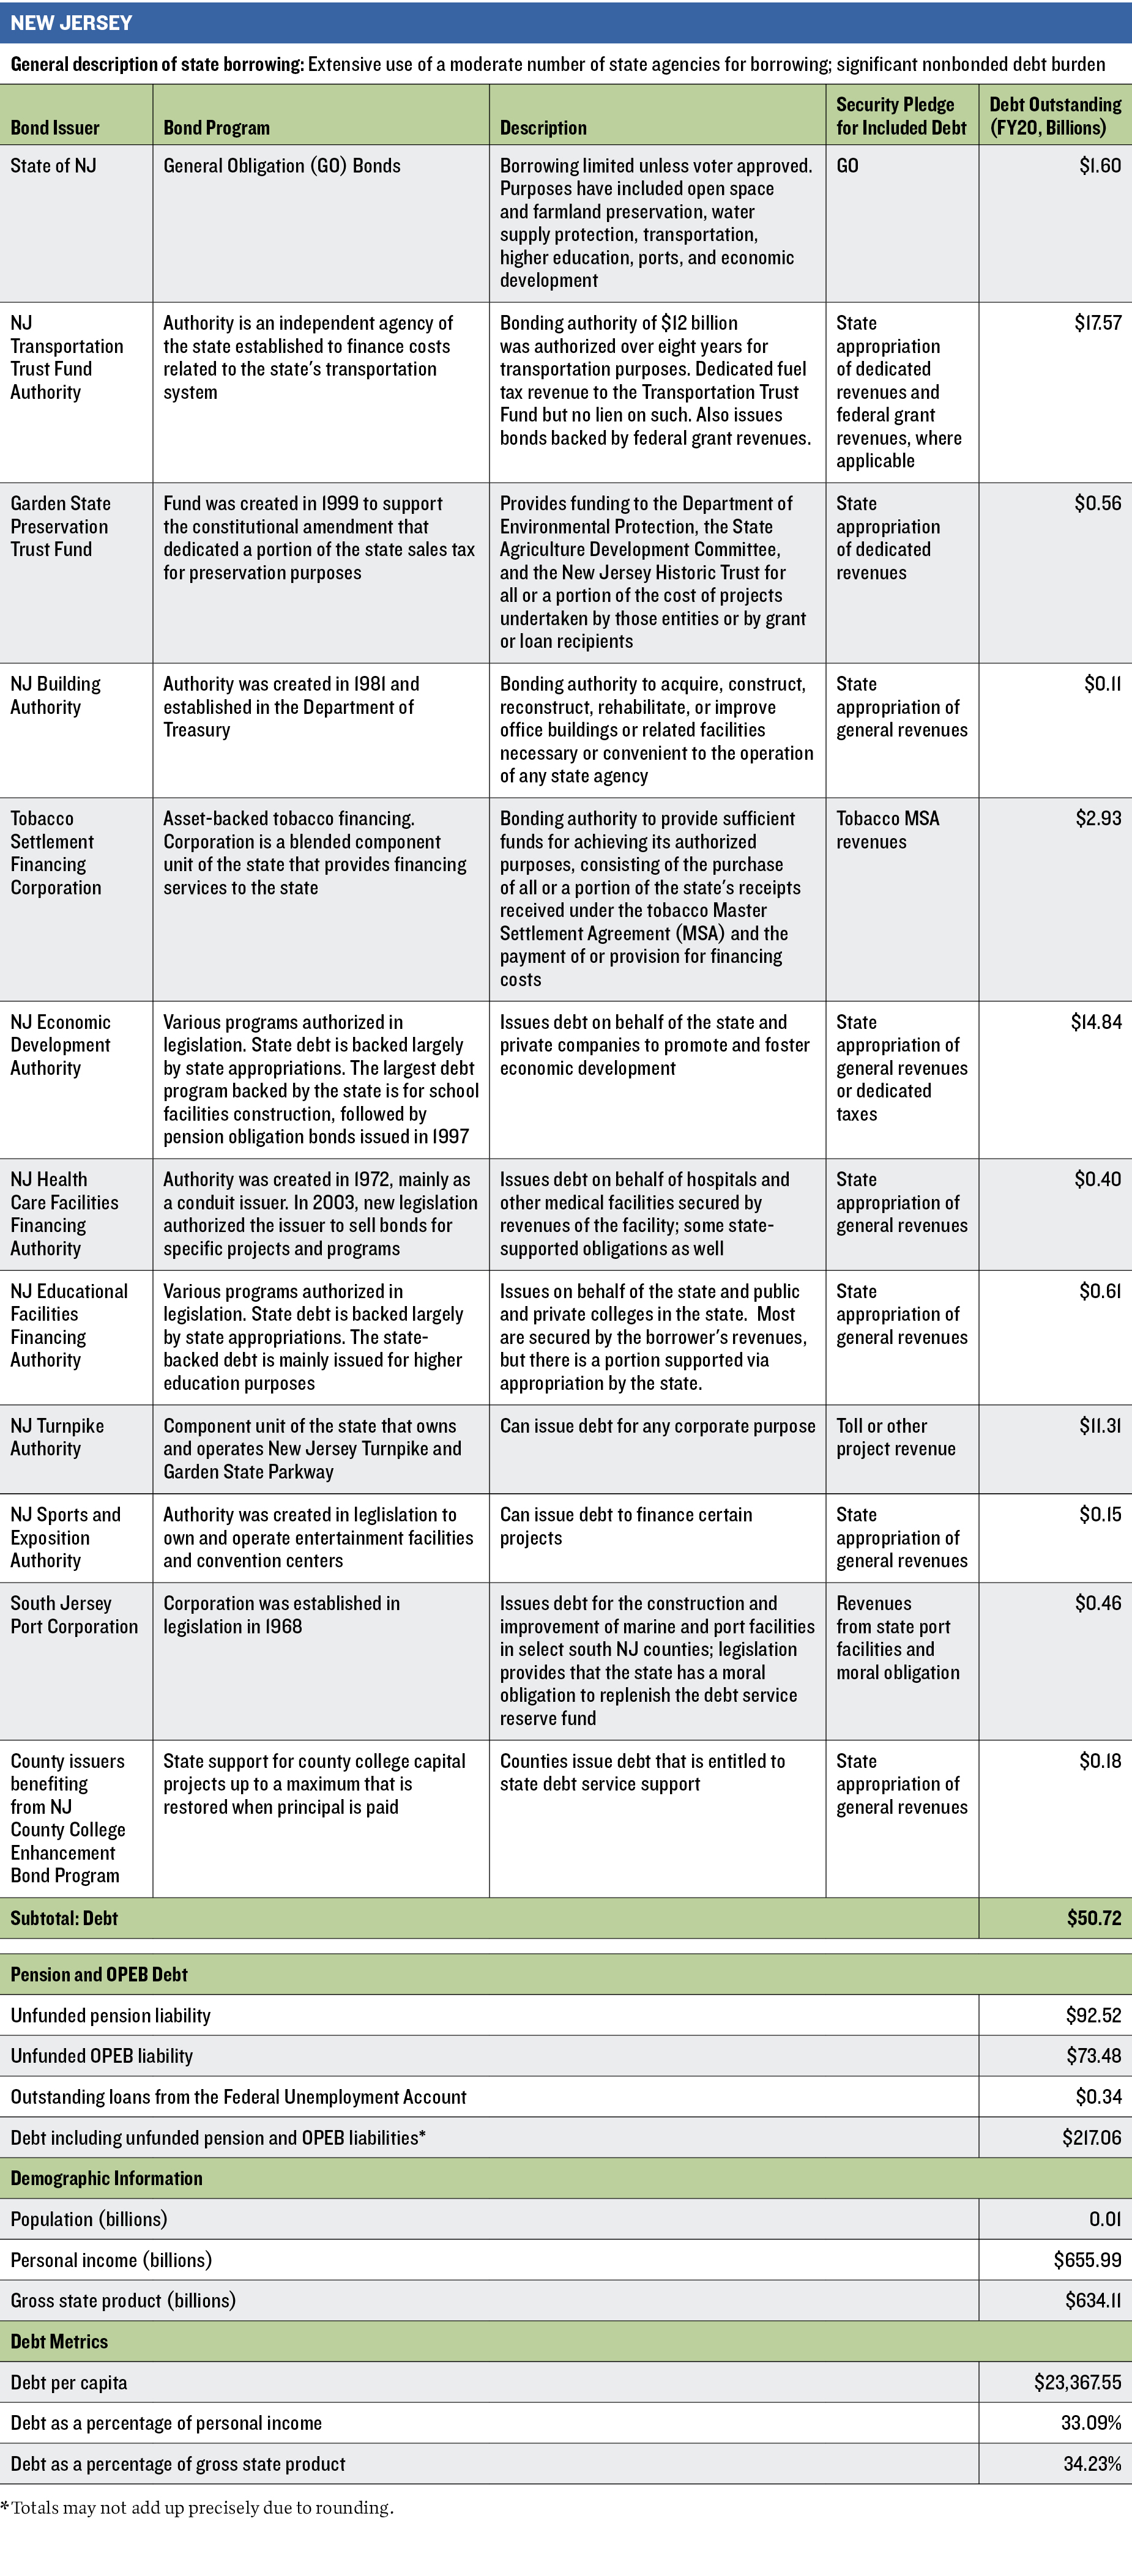
In this study, we examine New York’s current system of borrowing and compare it with those of four other states—California, Florida, Michigan, and New Jersey. Each state represents an archetype of traditional state debt practices and provides instruction for New York. For example, Florida accesses capital markets through a more diverse group of borrowers than New York but retains better control than the latter over each bond sale and aggregate issuance. In contrast, New York’s relatively modest $100 million unfunded pension liability at the end of fiscal 202110 contrasts with New Jersey’s prolonged decision to maintain budgetary spending by underfunding pensions and amassing retirement debt without the type of restrictions it faces on selling bonds to the public. And while many of New York’s borrowing practices may be an attempt to elude common voter approval requirements for general obligation debt, California proves that voters may be just as or even more willing than the state legislature to take on debt. We also find that among the five states, the total borrowings reflect differences in the role that each takes in providing public infrastructure and services.
To better compare states’ long-term budgetary exposure to debt, we have adopted an aggressive methodology that produces, in most cases, substantially larger bonded debt totals than reported by other sources, including states themselves. Large or frequent borrowing alone is not a problem for any state, particularly if borrowed funds are used to improve long-term economic resilience via investment in infrastructure and services and a reduction of social and economic inequality. But such a strategy—if not disclosed well enough to convey the full economic linkages between borrowers and those repaying the loans—may limit transparency about the total amount of debt incurred.
Because its debt system is ultimately more permeable than it appears and because each dollar of debt incurred should be properly disclosed and accounted, New York’s debt practices pose incremental risk to both the state and its citizens. In a 2017 report, Public Authorities by the Numbers, the New York state comptroller’s office reported: “State authorities’ finances and operations are often closely intertwined with those of the State itself. This has resulted in heightened concerns, in part because authorities are not subject to certain requirements that apply to State agencies and are intended to provide oversight, accountability and transparency. In some cases, it is unclear how authorities decide how significant amounts of State funding will be allocated.”11
Methodology
To examine whether state borrowing frameworks have led to different outcomes in transparency, accountability, or debt levels, we chose five states representing varying archetypes:
New York
California
Florida
Michigan
New Jersey
Although no two states can be compared exactly, a primary objective of the analysis was to maximize an apples-to-apples view of state debt profiles. This frequently required the inclusion of obligations that are defined as self-supporting but that nonetheless increase the state’s long-term current or contingent costs. To normalize findings, we measured the aggregate debt for each state against population, personal income, and gross state product. Our expanded definition of state debts includes
- issues for which the state has obligated itself to make payment, either in its own name or through any other entity (including municipalities) for capital or operating purposes. The obligation exists regardless of the security pledged for payment, including general obligation, legislative appropriation, dedicated tax, or another specified revenue stream;
- contingent obligations of the state to repay debt;
- implicit state support of a bond beyond regular budgetary support provided by the state to the entity or program;
- obligations of critical state-related entities that may generate insufficient revenues to meet debt service obligations;
- debts of state-related or state-controlled entities that are used to support the general fund budget via upstreaming of cash; and
- unfunded pension, OPEB, and state unemployment insurance trust fund liabilities.
Overview of State Bonded and Nonbonded Debt
Forty-eight states limit issuance of general obligation debt in some way, according to a 2018 Pew Charitable Trusts study.12 Limits are usually contained in state constitutions, but stand-alone or supplementary statutory restrictions are not uncommon. Thirty-three states require, at a minimum, voter or supermajority legislative approval for a specified borrowing program or bond issue. Most others require nominal or relative dollar debt caps with respect to either total principal or annual debt service. Many states require a mix of all these restrictions, and a handful do not allow any general obligation issuance at all.
Such constraints notwithstanding, nearly all states still find ways to borrow above—and despite—their debt limits, often by issuing different kinds of bonds than those restricted by law. These alternative debt structures vary considerably but can include bonds whose payment is subject to annual appropriation by the legislature rather than the state’s full faith and credit. Legislative failure to appropriate funds does not trigger a legal event of default, however. This is because investors and credit rating agencies do not require the full faith and credit pledge; they assume that the state will eventually honor the promise to repay the bonds in full, regardless of future events. Debt alternatives also include revenue bonds, usually secured by and paid with receipts from specific state taxes or fees, such as sales or motor vehicle taxes or tolls. General obligation debt alternatives can be issued and paid by the state itself or through a state-level entity or department.
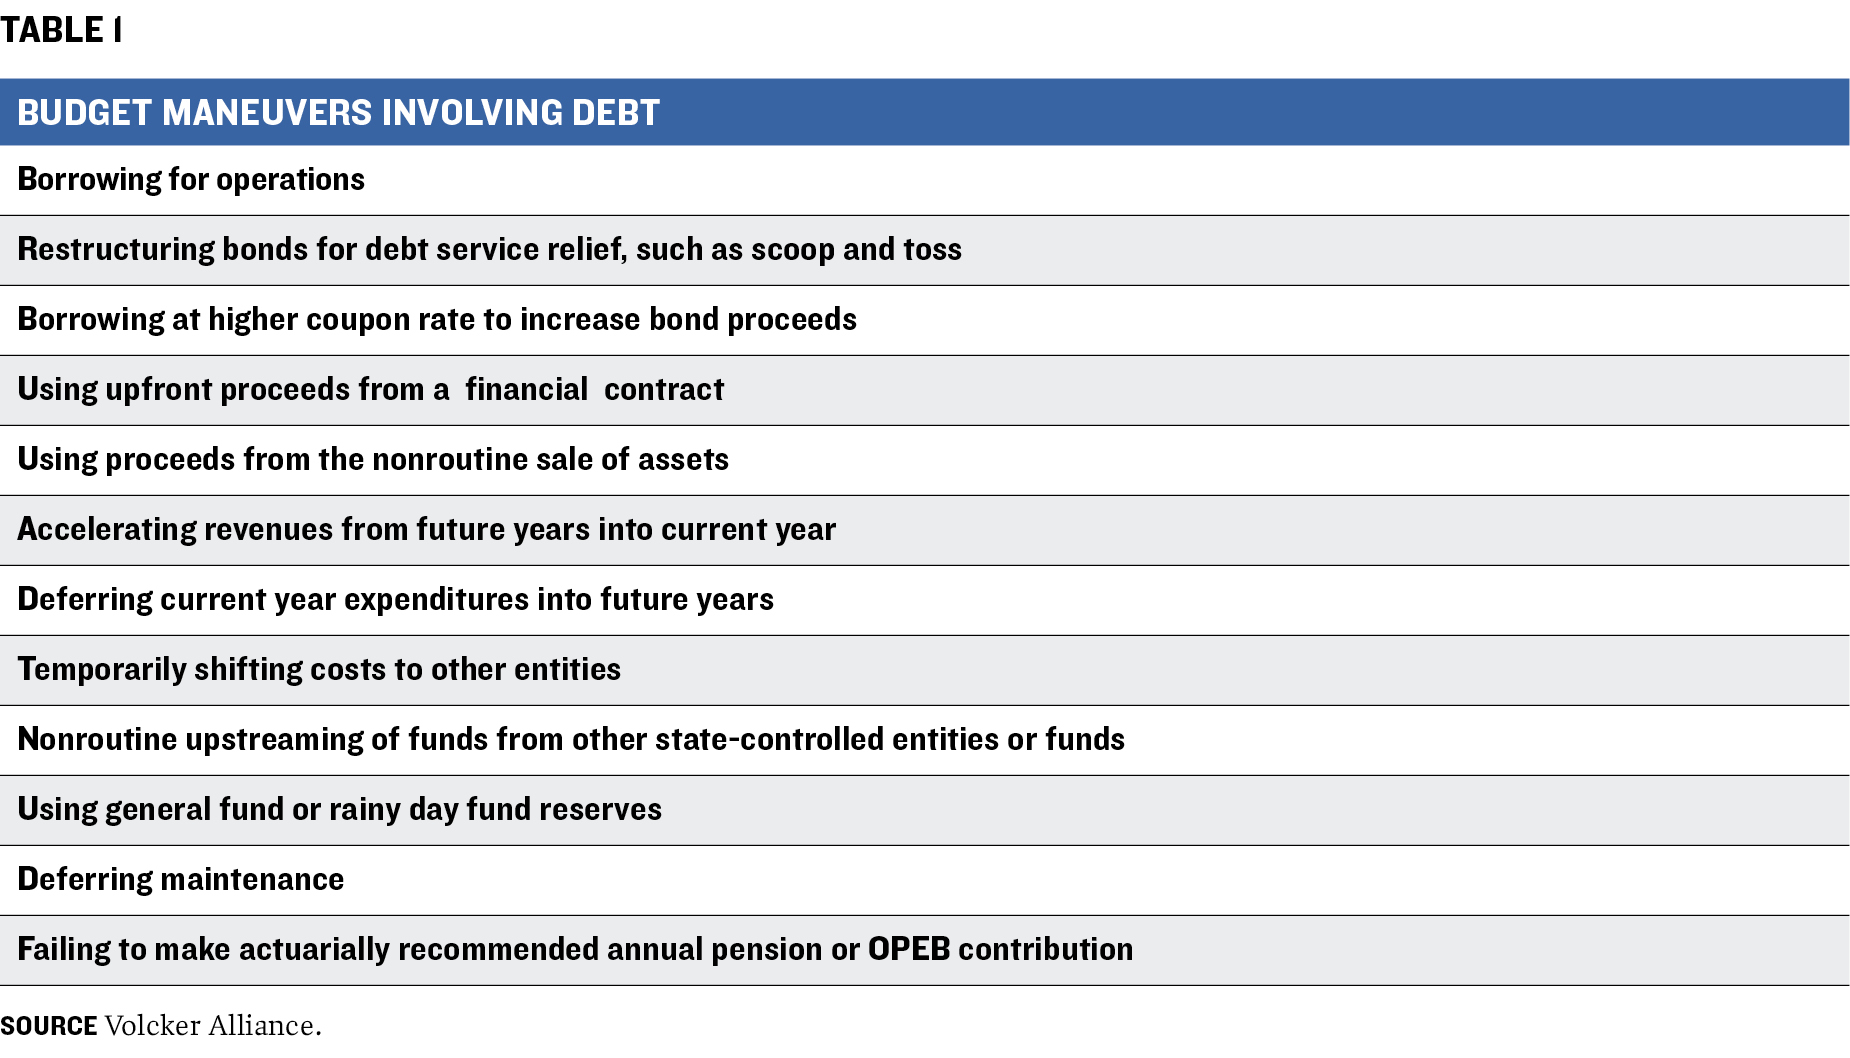
Nearly all states also borrow money outside capital markets, frequently in an effort to temporarily paper over a structural budgetary imbalance. For example, states can borrow from the US Treasury to shore up an insolvent unemployment insurance trust fund. They may also use cash from special funds to rebuild the general fund. In addition, failing to provide actuarially required pension or OPEB payments can be an expensive way to finance a shortfall, as it comes at the cost of the respective fund’s assumed annual rate of return on its investments. In its series of Truth and Integrity in State Budgeting reports, the Volcker Alliance has cataloged multiple other ways states incur nonbonded debts to achieve budgetary balance (table 1).
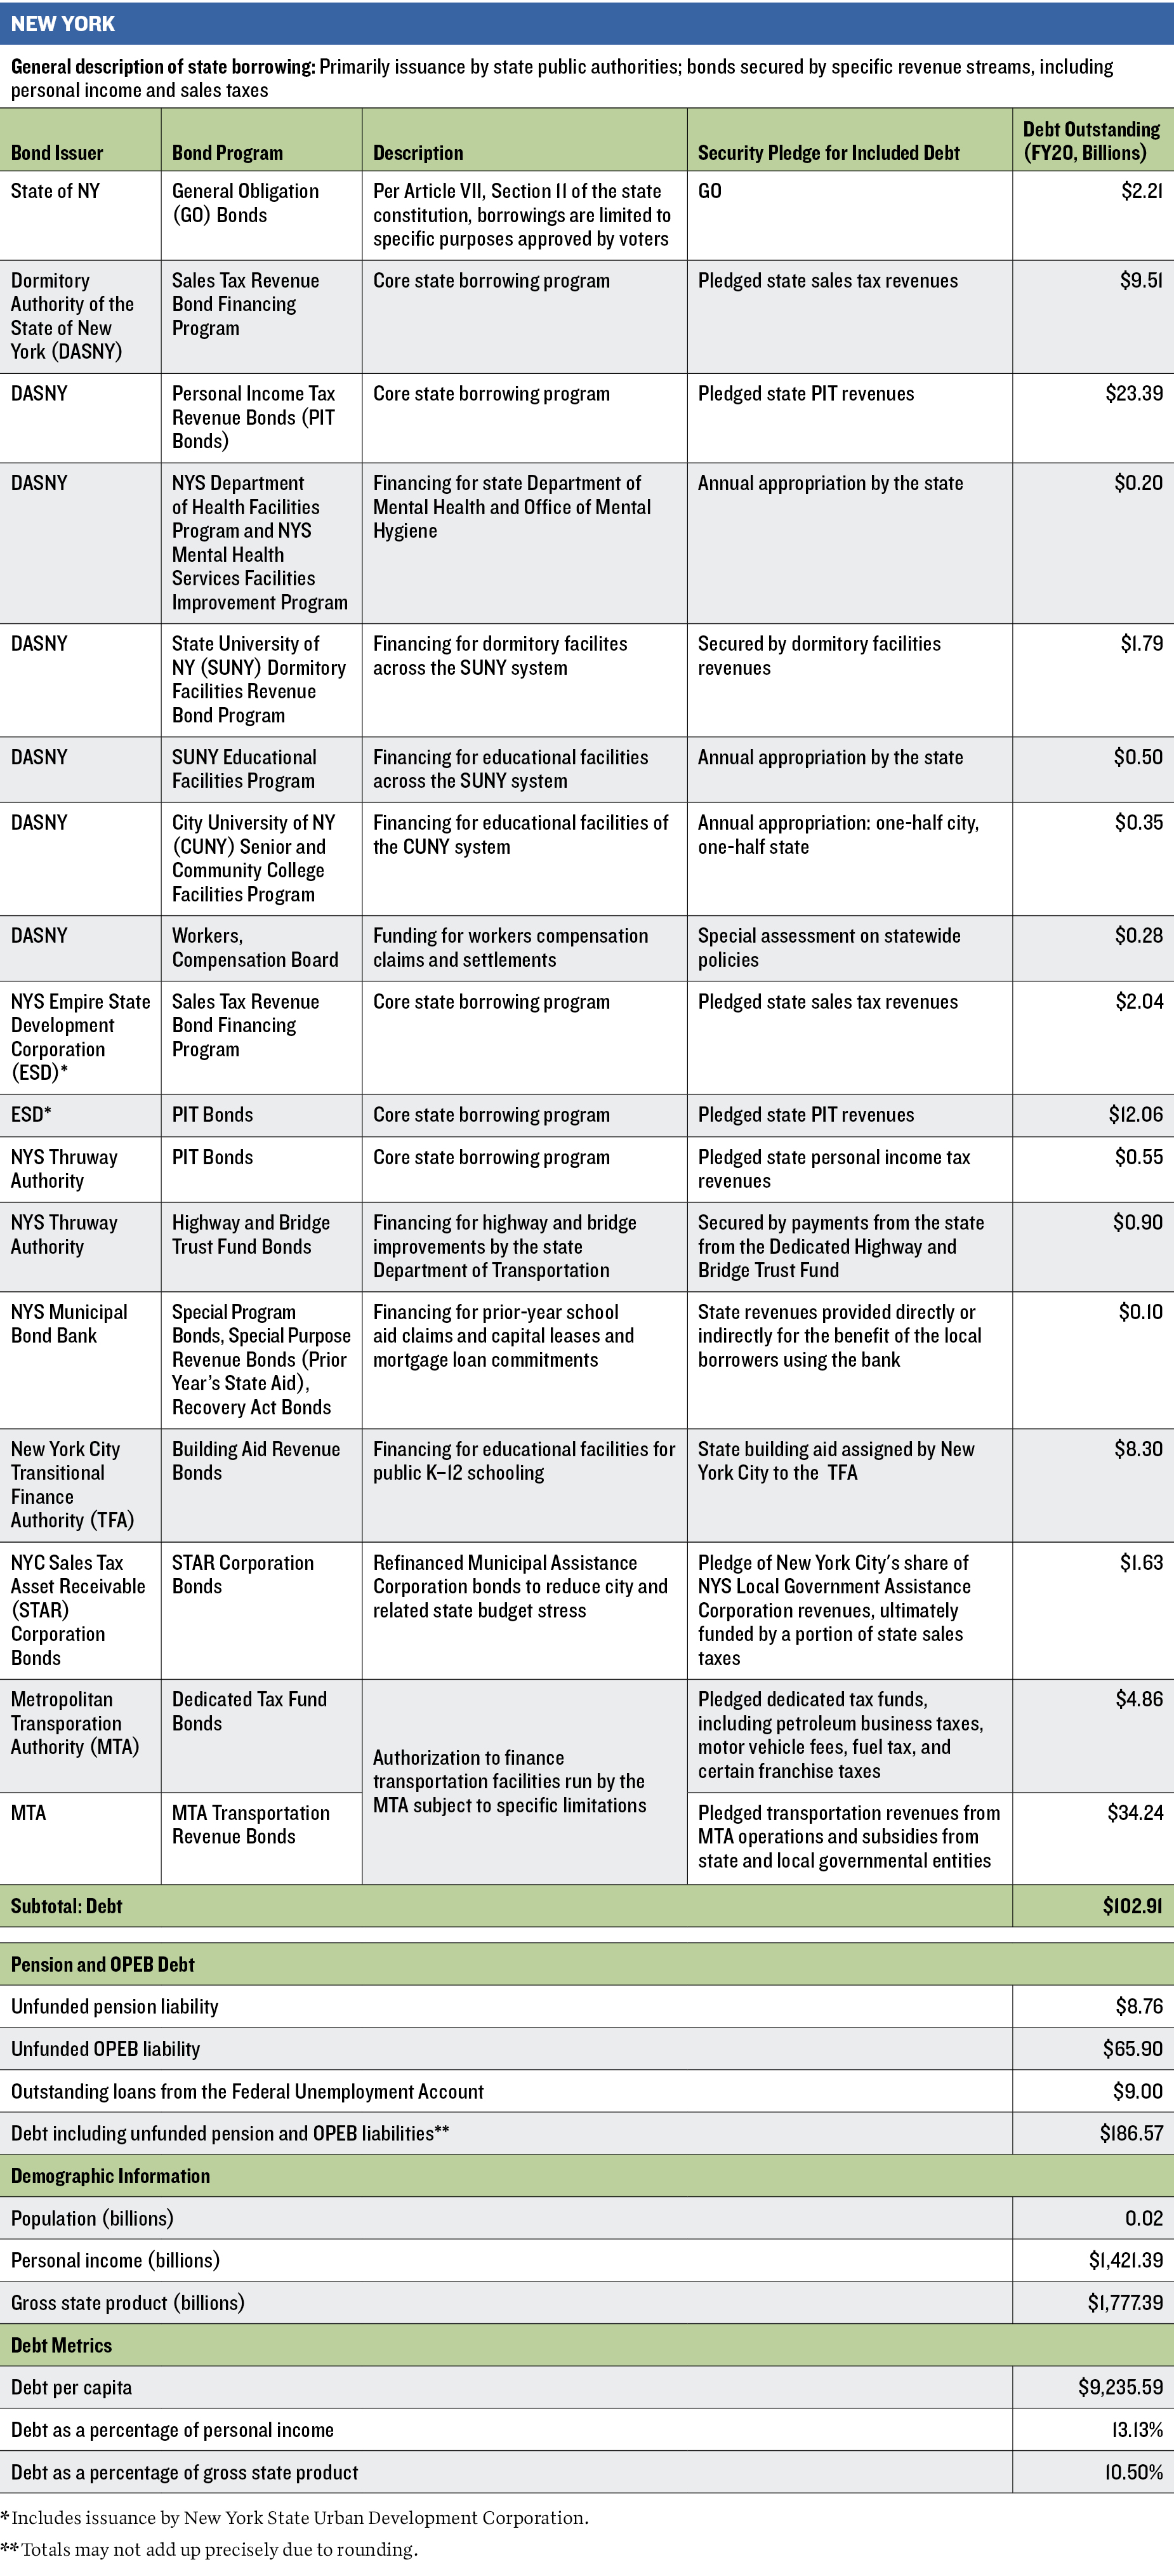
Since the passage of the Debt Reform Act of 2000,13 New York has made substantial progress in simplifying its core borrowing programs. The state now provides useful, regular disclosures on these programs via the Division of the Budget’s Annual Information Statement, quarterly updates, and occasional supplemental reports.14 Before 2000, the state relied heavily on debt issued by a variety of public authorities and other entities, with payment backed by special appropriations, service contracts, or dedicated tax pledges. This system decentralized control of borrowing, limited transparency of the state’s aggregate legal and economic debt exposure, and facilitated the use of debt for operations. In 1990, for instance, New York refinanced its rising and problematic use of seasonal and operational borrowing through the Local Government Assistance Corporation, which ultimately issued $4.7 billion of revenue bonds backed by a quarter of the 4 percent state sales tax.15
The Debt Reform Act defined the term state-supported debt and restricted its use to capital investments; set maximum debt maturities of no longer than thirty years; and imposed other limits, including restricting outstanding state-supported debt to no more than 4 percent of state personal income and capping debt service costs at 5 percent of total fund receipts. As defined by law, state-supported debt in fiscal 2020 included general obligation bonds (about $2 billion outstanding), personal income tax bonds (about $37 billion), and sales tax revenue bonds (approximately $12 billion).16
The Division of the Budget oversees the state’s personal income tax and sales tax borrowings using three state authorities as conduit issuers—meaning they sell bonds that the state, rather than the authorities, are solely responsible for repaying. The three are the Dormitory Authority of the State of New York (DASNY), New York State Thruway Authority, and New York State Urban Development Corporation, which was founded to help finance construction of low- and moderate-income housing.
Despite the Debt Reform Act, state policy has been adjusted regularly to avoid constitutional constraints on debt. For example, New York’s use of general obligation bonds is also limited by the state constitution, which requires that voters in a general election approve of borrowing for a specific purpose.17 As of 2021, the state would very likely have lower borrowing costs because of high investor demand for general obligation bonds relative to their supply, but it has not sought voter authorizations. In fact, New York’s fiscal 2022 capital plan assumes that 98 percent of the $10 billion of spending to be financed through bond sales will come from state authority bonds, with only $200 million of the total generated by proceeds of general obligation debt sales.18 These numbers reflect New York’s regular use of borrowing vehicles that, by falling outside the Debt Reform Act’s definition of state-supported debt, are not subject to the statute’s limits.
Below, we highlight New York’s excess borrowing through statutory and other changes. We also consider the state’s use of nonbonded debt via employee compensation-related liabilities and past borrowings within the state budget itself.
While New York has sometimes appeared close to exhausting its state-supported borrowing capacity under the Debt Reform Act, it has repeatedly adjusted its statutes to ensure adequate coverage and investor demand. Similar alterations may occur in the future should caps again impinge on the state’s ability to borrow. Adjustments in borrowing procedures have included the following:
-
New personal income tax (PIT) and sales tax bonds. When the PIT structure was created in 2002, it committed 25 percent of personal income tax collections to pay debt service on bonds backed by the levy and released the balance to the general fund. As bondholders’ portfolios became saturated with the PIT securities, the state could have subjected its borrowing program to voter approval of new general obligation debt or increased the volume of revenues allocated to the PIT bonds to improve their attractiveness to investors. Instead, it created a new security—debt backed by sales tax collections—to dodge the constraints of the first two options. New York began issuing bonds through this new program in 2013.
-
Adding taxes to PIT bonds. In response to the 2017 federal Tax Cuts and Jobs Act’s restriction on individual taxpayers’ ability to deduct state and local taxes, New York attempted to let residents reduce their tax bills via a new charitable deduction provision. Because that structure would have reduced personal income tax collections, the state expanded the PIT bond structure’s capture of income tax receipts to 50 percent from 25 percent to ensure adequate coverage for debt service. Although the charitable deduction provision did not survive a challenge by the Internal Revenue Service,19 PIT bonds’ deeper draw on the state income tax remained in place.
-
Emergency waivers of statutory caps for COVID. Citing concerns for its solvency and program delivery amid the COVID-19 pandemic, New York in 2020 exempted its state-supported bond issuance from the Debt Reform Act’s limits. The state did so again in 2021, even after mid-pandemic revenue and federal aid both exceeded expectations. This move highlighted the flexibility in state’s definitions of an emergency and suggests that New York bondholders should assume that it will loosen statutory borrowing restrictions in the future if needed.
New York has also shown that the structure of bonds can help it avoid debt limits. For example, like most states, it regularly borrows through channels that carry fewer restrictions than those applied to general obligation debt—for instance, bond securities not subject to Debt Reform Act or constitutional limits. To discuss these, it is useful to consider definitions of the state’s debt categories:
-
State-supported debt refers directly to statutory debt limits and allowances created under the Debt Reform Act. State-supported debt outstanding cannot exceed 4 percent of annual personal income, as computed by the US Census Bureau of Economic Analysis, and debt service cannot exceed 5 percent of annual receipts by all state funds.
-
State-related debt is a broader term that adds a relatively small amount of contingent debt and bonds backed by legislative appropriations that are paid directly by the state.
-
State-funded debt is a term used by the state comptroller that adds materially large obligations that New York pays indirectly. This holds true “whether or not debt service is to be paid from a revenue stream transferred by the State to another party that is responsible for making such payments,” according to the comptroller’s office.20 This category includes the below:
State-funded debt
$8 Billion
$2 billion
$2 billion
Our definition of state debt adds obligations
These include:
$34 billion
$5 billion
While states face more than $1 trillion in unfunded pension liabilities,22 New York’s burden is relatively minor because of past reform efforts and disciplined funding. The state’s unfunded pension liability was just $9 billion at the end of fiscal 2019, 93 percent less than New Jersey’s.23 But New York carried $66.7 billion in unfunded OPEB obligations for state government and State University of New York employees as of fiscal 2020. As of October 13, 2021, New York owed another $9.2 billion to the US Treasury to cover pandemic-era loans it took out to prop up its unemployment trust fund.24
In fact, New York has been a consistent user of nonbonded budget borrowing and was one of only four states to average a D, the second-lowest mark possible, in the Budget Maneuvers category in the Volcker Alliance’s 2020 study of all fifty state budgets covering fiscal 2015–19. In the period, New York made repeated revenue and cost shifts between related entities and paid for recurring expenditures with debt, asset sales, or upfront revenues on financial transactions.
New York Compared with Other States
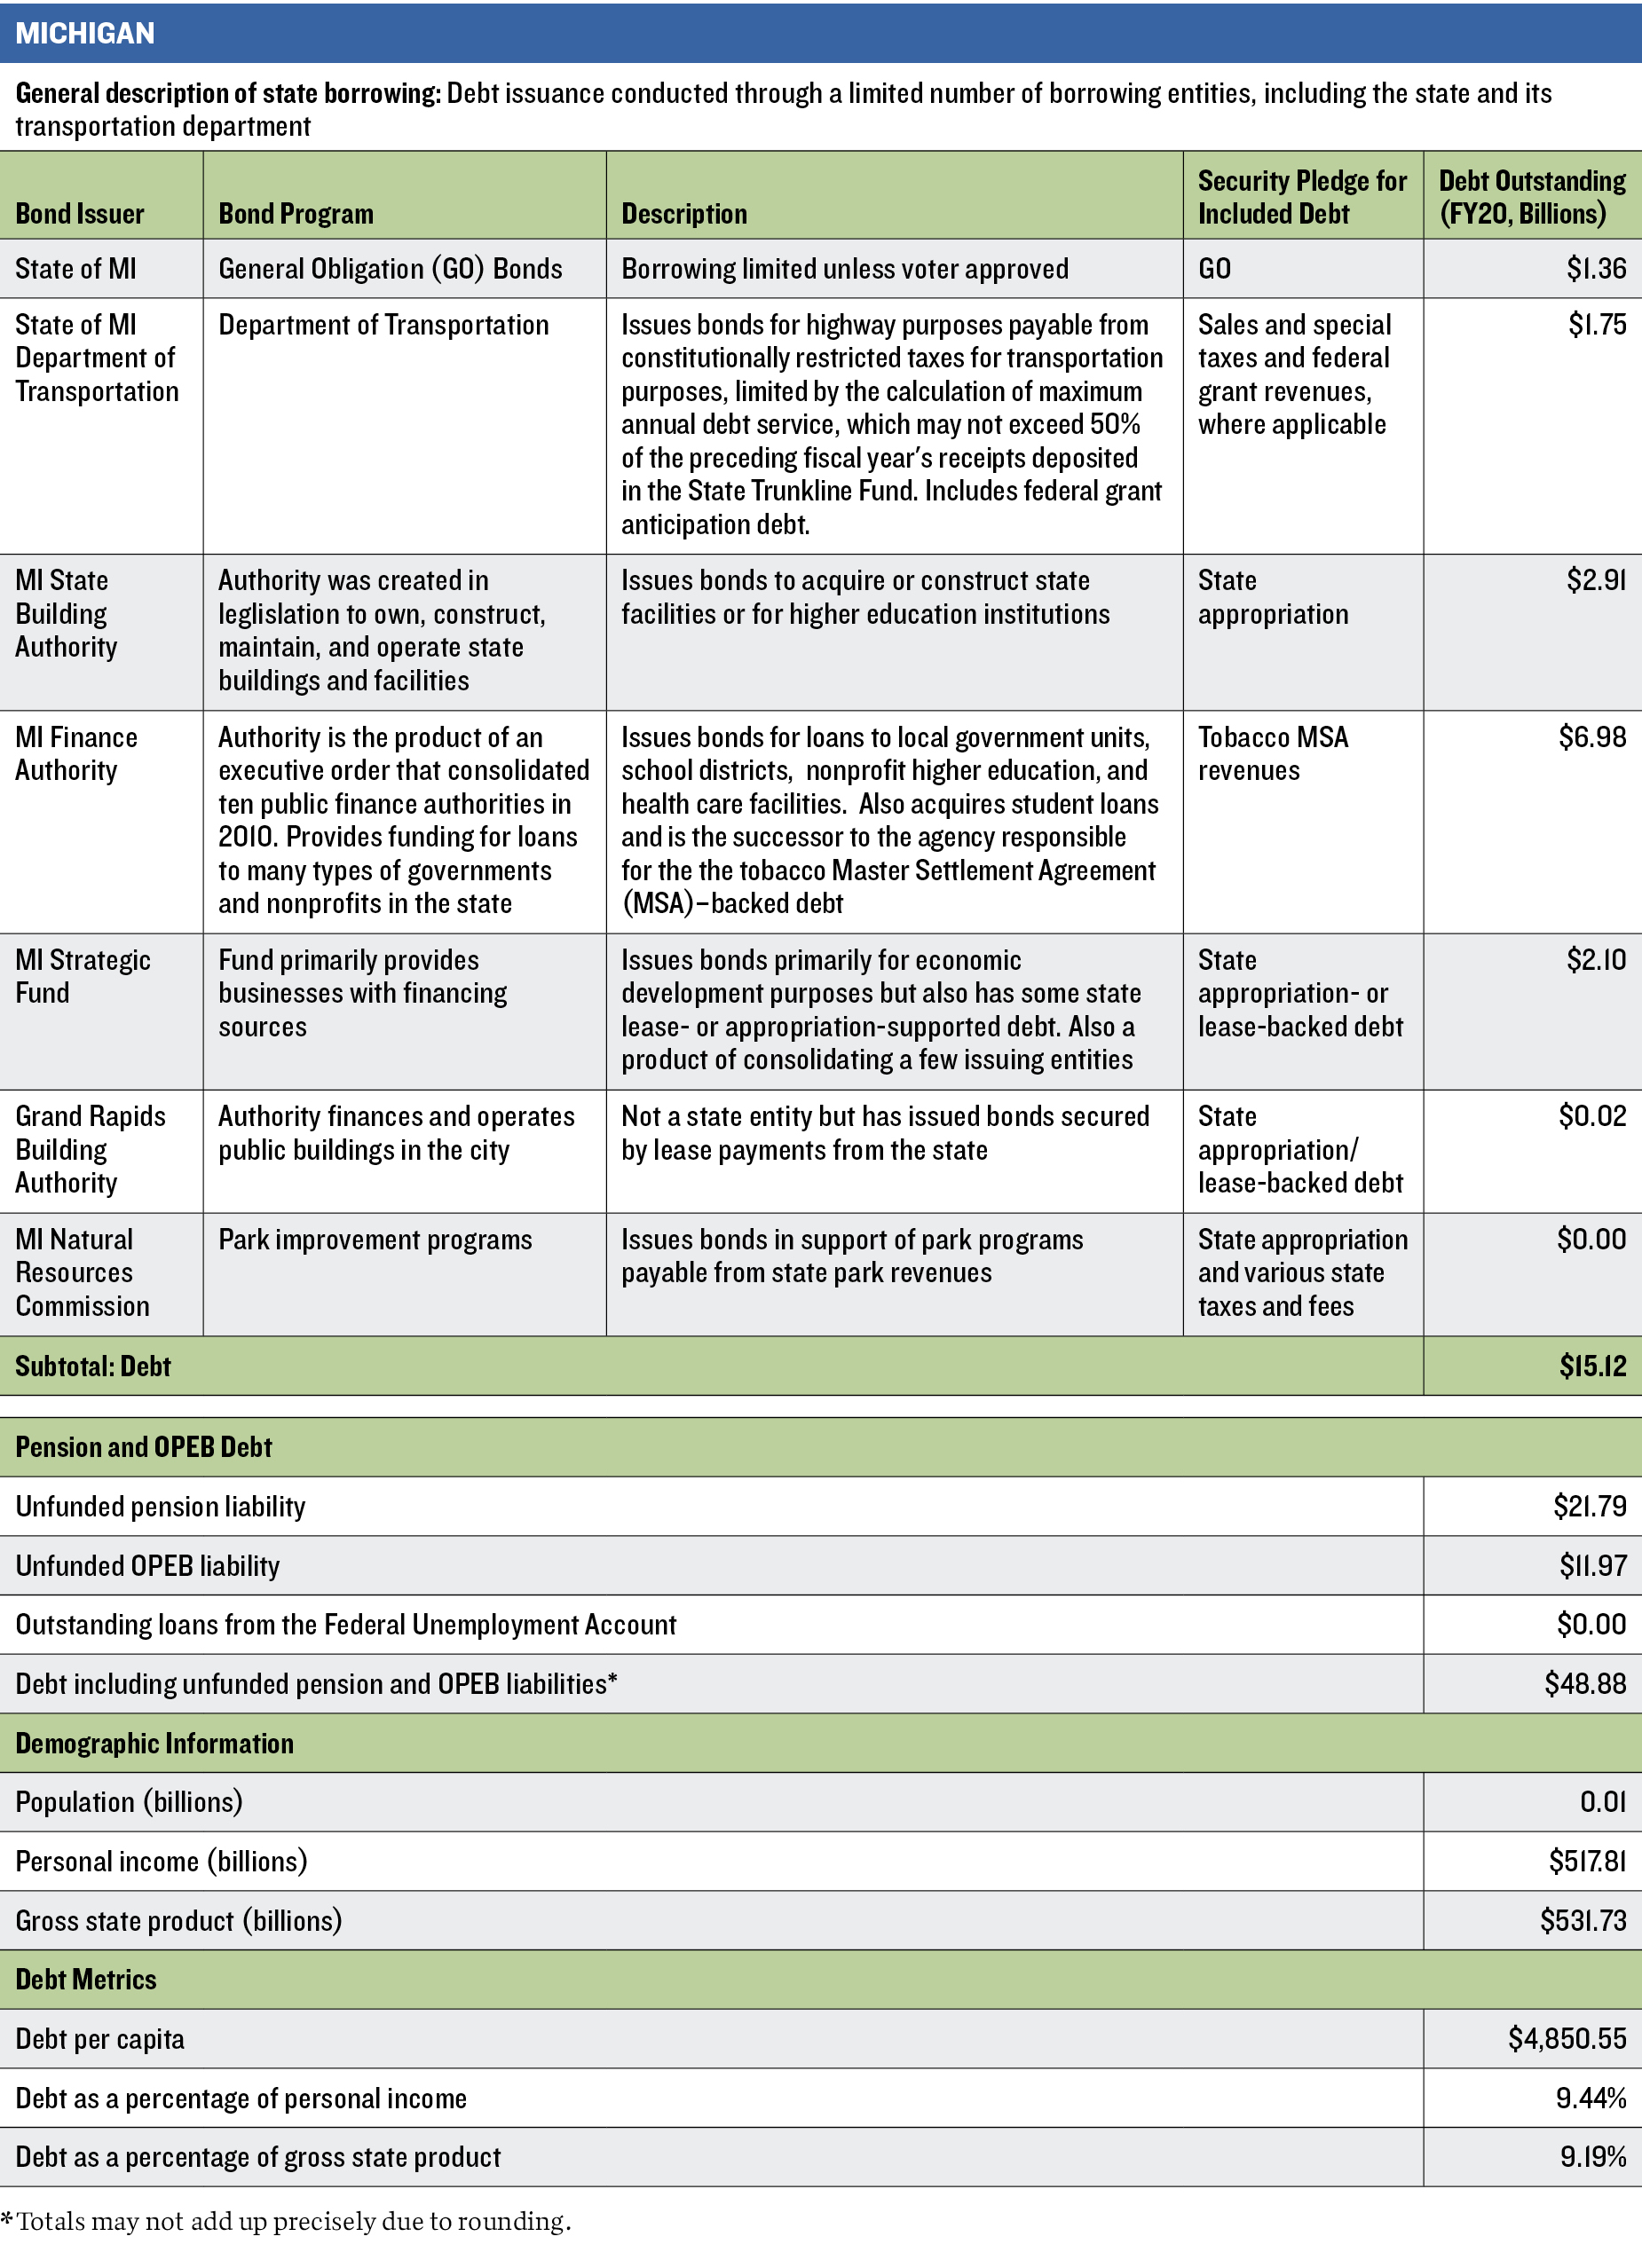
The median value of net tax-supported debt for US states is $1,039 per capita, equivalent to 1.9 percent of personal income, according to Moody’s Investors Service.25 Of the states examined in this paper, the agency reports that three are above that median (California, New Jersey, New York) and two are below (Florida and Michigan). When our expanded definition of state debt is applied, each state’s metrics rise to varying degrees; for example, Michigan’s debt as a percentage of personal income more than doubles, to 2.9 percent, from the reported 1.2 percent.
In table 2, we compare New York’s debt burdens to the other four states’. Looking strictly at bonded debts, those of New York and New Jersey tower over those of the others. In terms of indebtedness per capita, personal income, and gross state product, New York has about twice California’s leverage, which suggests a difficult path to balanced budgets. Similarly, New Jersey may feel more pressure to raise taxes, cut spending, or continue relying on nonrecurring budget solutions to achieve balance.
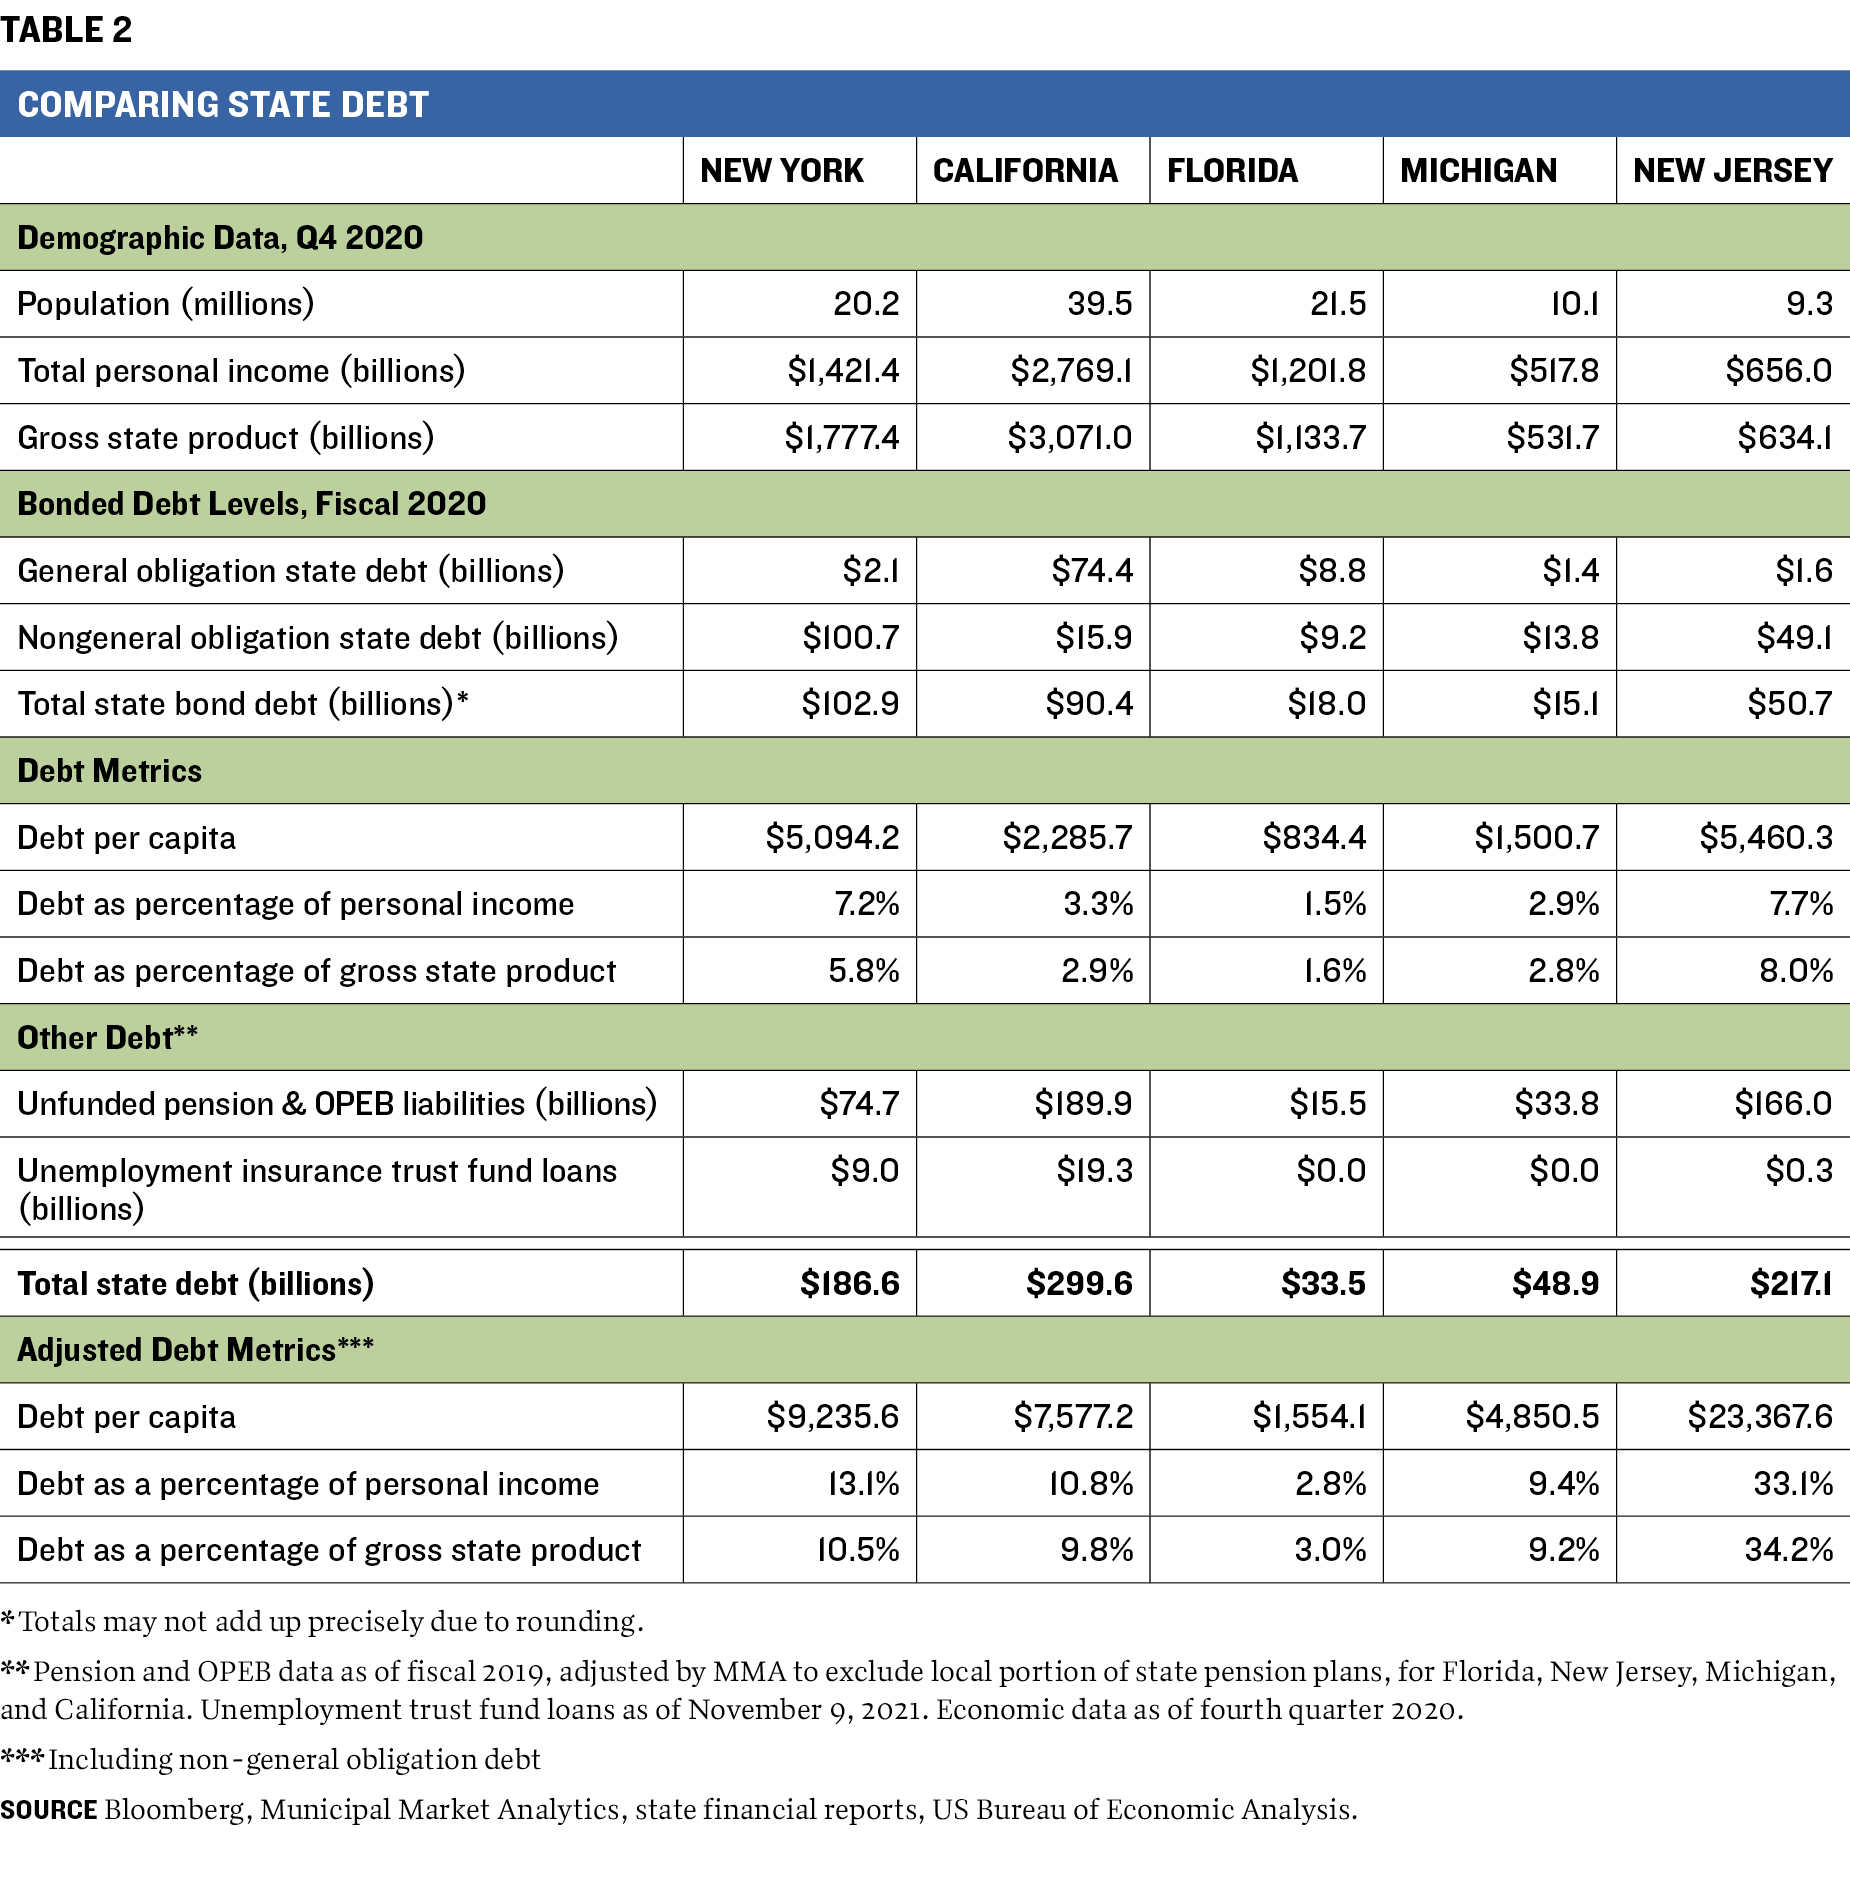
New York’s credit profile benefits from its relatively limited exposure to unfunded pension liabilities, although OPEB remains a challenge. The Governmental Accounting Standards Board, which regulates state and municipal financial reporting, requires that any net liability for OPEB be recognized on governments’ balance sheets in addition to that for pensions. Once pension and OPEB are added to the debt burden measures of the five states studied, the extent of New Jersey’s leverage is clear.
Complete tables of each state’s debts, cataloged by issuer, borrowing program, and security, are included in appendix A. Following are summaries of the four other states’ debt structures and amounts borrowed.
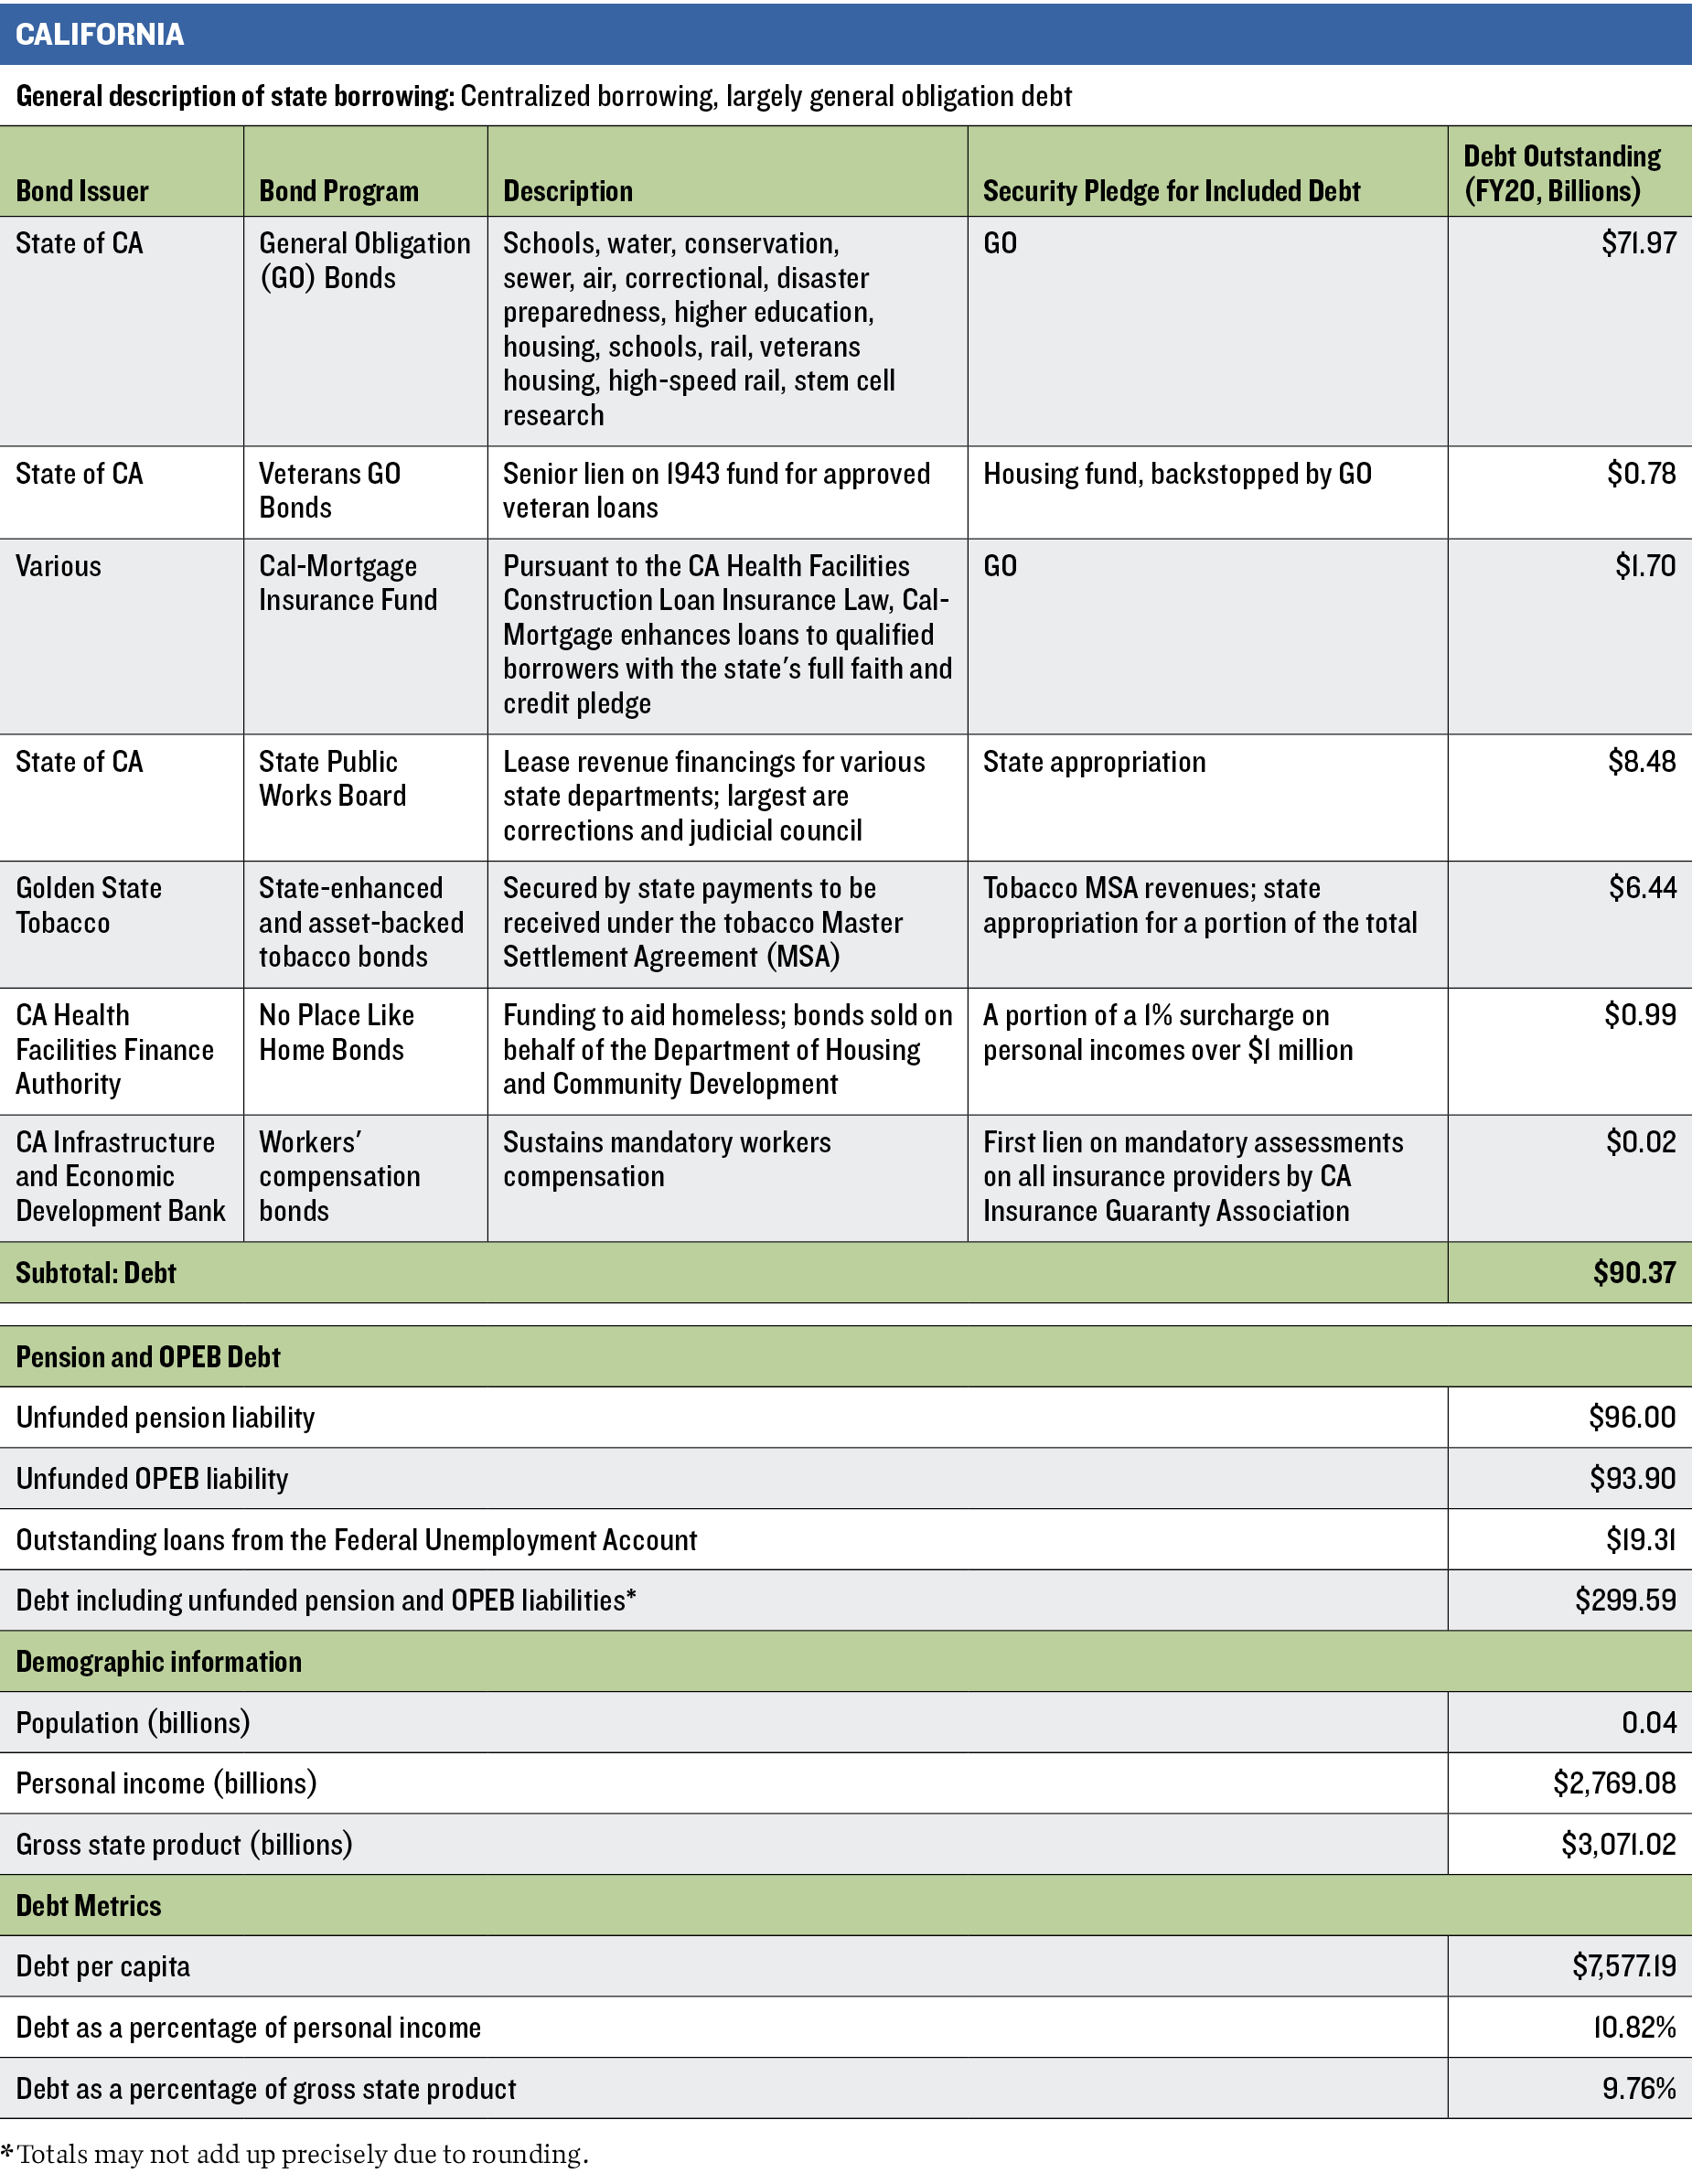
California
California is a highly centralized state borrower, with traditional, stand-alone general obligation bonds accounting for 80 percent of all state-paid debt. General obligation and direct appropriation debts, the latter issued through State Public Works Board and Golden State Tobacco Securitization Corporation financings, account for almost all the remainder. Under California’s constitution, general obligation bonds must be approved by voters and are payable from all state revenues, subordinate only to funding for public K–12 schools and universities. While the state treasurer produces an annual debt affordability study, measuring California’s indebtedness by various measures and against other large states, there are no quantitative limits on issuance of general obligation securities.
The state’s major revenue bond issuers include its two public university systems, the California Department of Water Resources and the Housing Finance Authority, infrastructure banks, and large conduit issuer programs. None of these appear to be connected directly or indirectly with the general fund and thus are excluded from calculations of state debt.
California also is burdened by substantial unfunded pension and OPEB liabilities totaling about $190 billion as of fiscal 2020,26 more than double the general obligation debt owed by the state at the end of fiscal 2019. As of November 9, 2021, California’s unemployment insurance trust fund also had $19.3 billion in federal loans outstanding—more than any other state.27
The Volcker Alliance gave California a top A average in Budget Maneuvers for fiscal 2015–19 for its negligible use of one-time measures to finance recurring spending. This is in sharp contrast to years before and after the Great Recession, when the state made heavy use of nondebt financing techniques to close budget gaps. California received a D average in the Legacy Costs category, however, a mark that reflects the unfunded liabilities and the state’s failure to make actuarially recommended pension and OPEB contributions in 2018–19.
Lesson for New York
California presents a counterpoint to the traditional narrative of voter approval requirements being an onerous obstacle to a state’s using a general obligation pledge as security on bonds. Almost all of California’s outstanding bond debts have been approved by majority vote in a statewide election, and substantial additional authorizations ($33 billion as of July 31, 2021) remain unused and unissued. For the most part, California has chosen to rely on its premier security—the general obligation bond—to minimize borrowing costs and improve acceptance and trading liquidity in the secondary market.
Florida
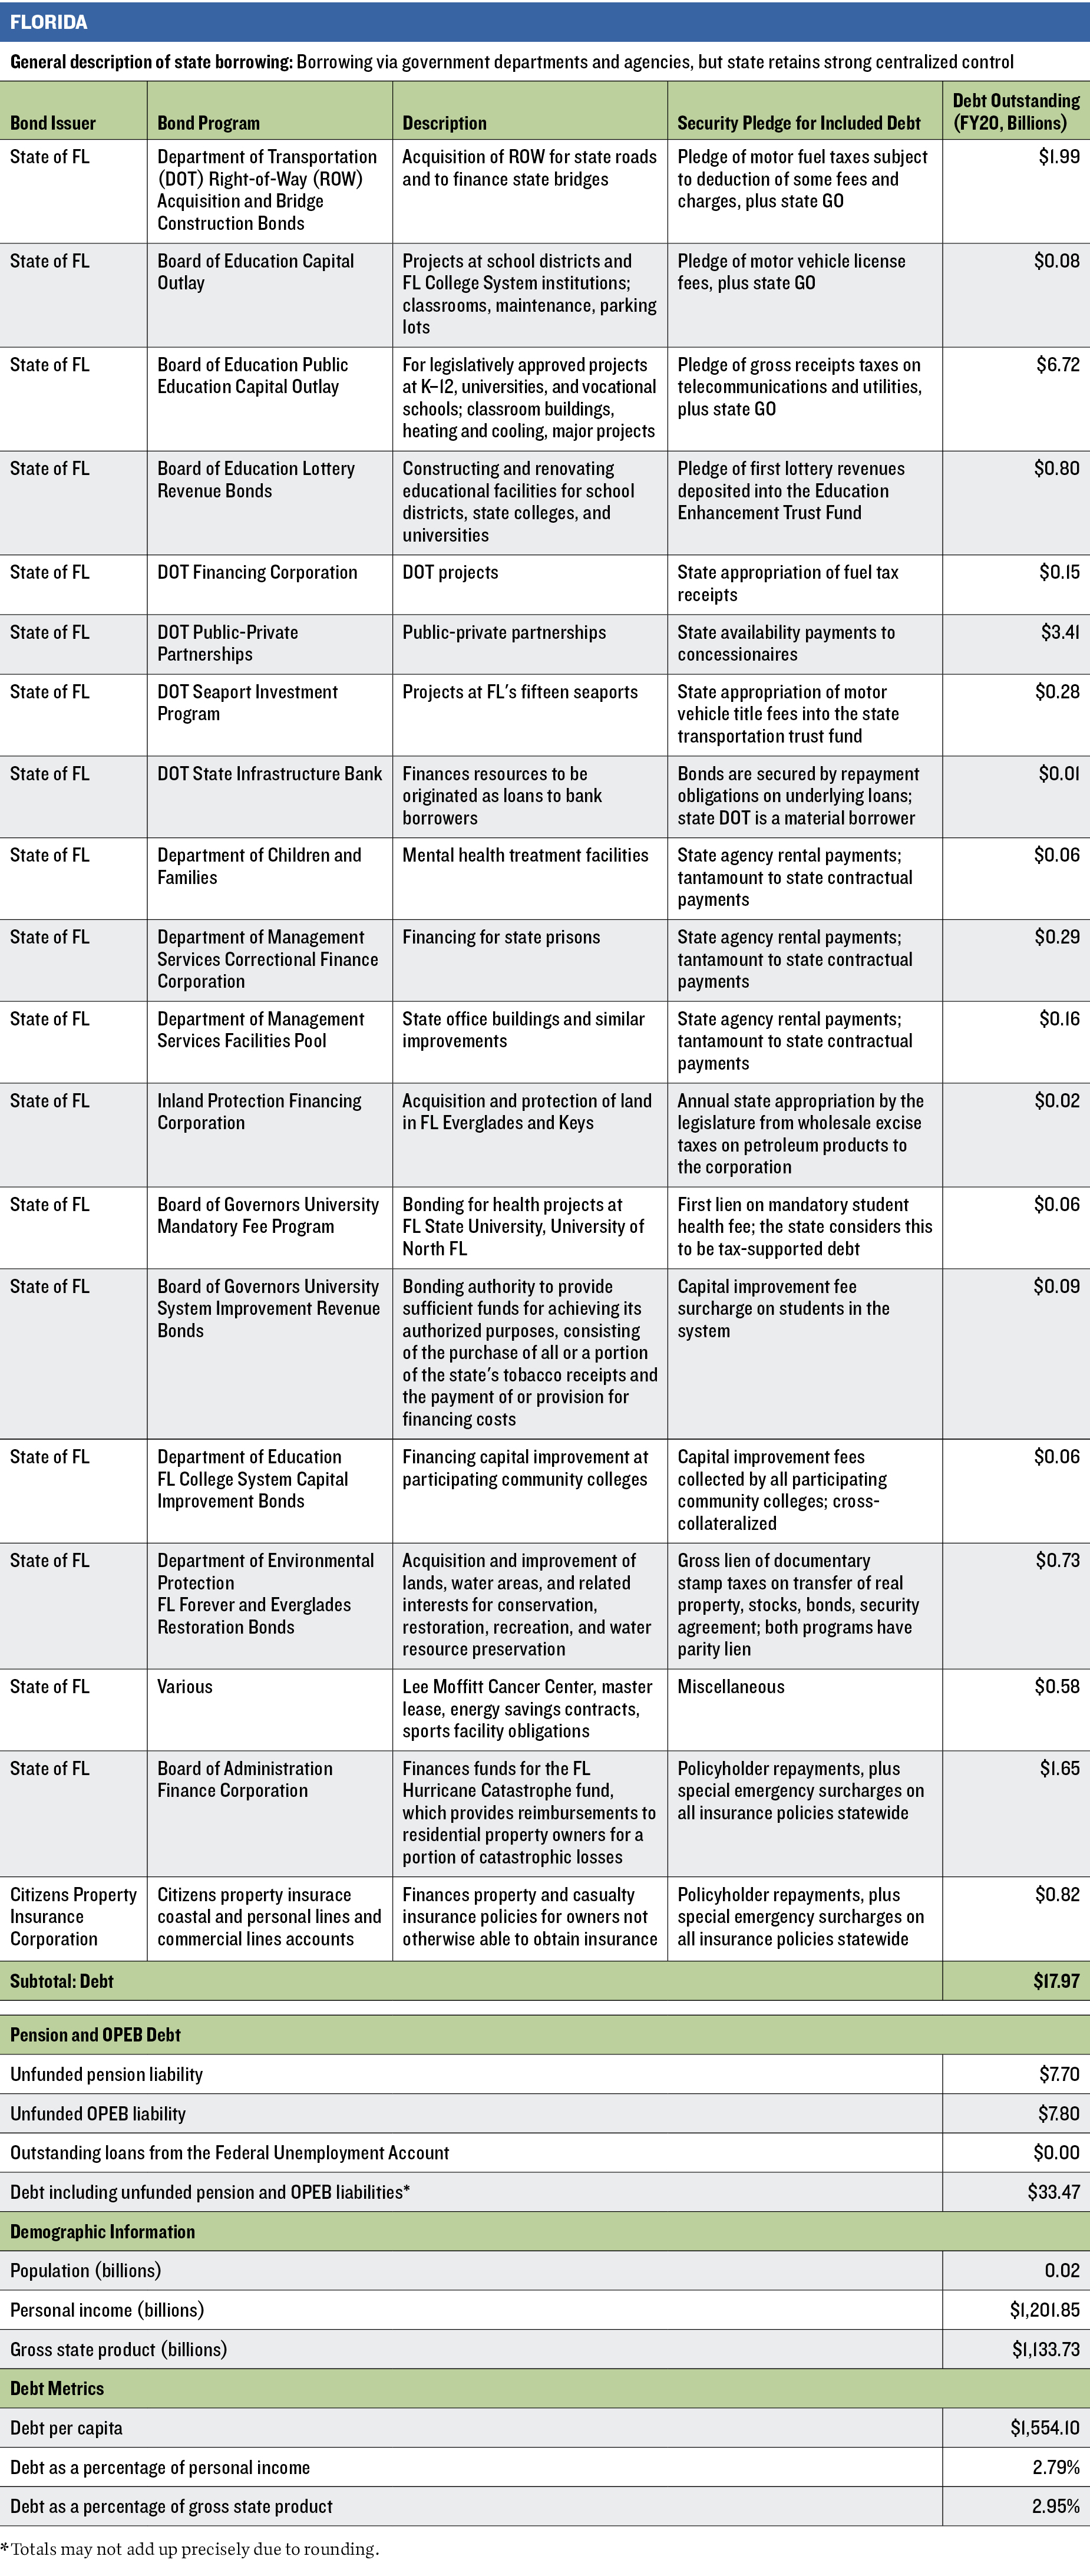
Florida has a decentralized system of borrowing (with at least ten borrowing agencies and more than two dozen unique bond securities). But almost all state-paid debts are issued through and ultimately controlled by the state Division of Bond Finance, which the legislature created in 1969 to issue securities on behalf of local governments and agencies.28
While its constitution allows Florida to sell voter-approved debt paid solely via a general obligation pledge, the state has instead secured its borrowings with dedicated tax backing, with some issues supported by a general obligation promise. The state calls its obligations revenue bonds, but because the pledged taxes are essential state revenues that flow back to the general fund once debt service is paid, the securities are widely considered tantamount to traditional state debt.
Each security is limited by revenue-specific tests of adequacy versus debt service, and Florida’s overall borrowing is capped, by statute, at 7 percent of all state revenues. The bond finance division provides regular updates on state debt metrics.
Prone to hurricanes and floods, Florida also owns a property and casualty insurer and a reinsurer of last resort; both can raise funds via a statewide assessment on the totality of insurance policies. Because of that backstop, these insurers are included in the state’s debt balance by the rating agencies and this study.
Florida’s debt levels become somewhat less conservative when unfunded pension and OPEB liabilities are included. These totaled $15.5 billion in fiscal 2019—almost equal to the amount of directly payable bonded debt issued by the state.
The Volcker Alliance awarded Florida a B average in Budget Maneuvers for fiscal 2015–19. While the state eschewed the use of debt to achieve budgetary balance, its mark reflected shifts of trust fund money into the general fund. While the state funded pensions adequately, its C average in Legacy Costs stemmed from a failure to make actuarially recommended OPEB contributions.
Lesson for New York
Florida has more state borrowing entities and more borrowing security types than New York. But Florida retains exceptional control over its debt portfolio by allocating related responsibility to a single agency run by an office reporting directly to the governor. The office helps improve borrowing costs by providing deep, detailed reporting to investors and other stakeholders, and it has a single point of contact and reference for the legislature and governor’s office.
Michigan
Michigan’s issuance of general obligation debt is limited by its constitution. It allows such debt to be used for a set amount of short-term borrowing for operating funds, for bond issues to fund loans to school districts, and for other purposes approved by voters. The state issues nongeneral obligation bonds in its own name, for roads secured by taxes restricted for transportation, and through the State Building Authority for constructing or acquiring buildings and facilities. Through lease payments and appropriations, the state also supports a portion of the debt issued by the Michigan Strategic Fund, which assists economic development and job creation efforts.
Unlike New Jersey, which uses state agencies to sidestep its constitutional limit on general obligation debt, Michigan’s rules and oversight appear to have kept its aggregate borrowing comparatively lower over time. However, like New Jersey—albeit to a lesser degree—Michigan’s other nonbonded debts significantly increase its leverage.
For fiscal 2015–19, the Volcker Alliance gave Michigan an A in the Budget Maneuvers category, although prior years had seen examples of revenue and cost shifting and funding of recurring expenditures with debt. Michigan received a B for its management of pension and OPEB funding costs.
Lesson for New York
Michigan’s debt issuance is more concentrated than New York’s. Borrowing done through other state entities or agencies is subject to more state-level oversight, which may contribute to Michigan’s lower bonded debt metrics.
New Jersey
New Jersey’s constitution limits its ability to incur general obligation debt by requiring voter approval when the outstanding amount exceeds 1 percent of appropriations. Because of this constraint, most state debt is issued under alternative borrowing entities and backed by a so-called subject to appropriation pledge, regardless of the payment source (such as general state revenues or dedicated revenues). The largest issuers of such debt are the state Transportation Trust Fund Authority and the Economic Development Authority, which together accounted for about 80 percent of New Jersey’s bonded debt outstanding as of June 30, 2020. Several minor state obligations have been incurred through other issuers and a state moral obligation pledge to repay the debt.
The state also routinely leverages the strong financial position of the New Jersey Turnpike Authority by moving cash from the authority to the general fund to limit state borrowing or avoid spending cuts. The authority provided $820 million to the state in fiscal 2017–21 and is scheduled to hand over an additional $3.6 billion in fiscal 2022–28. It will then continue to convey $525 million per year to the state until New Jersey Transit, the mass transportation agency, ceases its current practice of transferring funds from its capital budget to its operating budget to help hold down fares.
While New Jersey’s bonded debt is higher than that of many other states, it is far less than the unpaid long-term obligations the state has amassed by failing to make actuarially recommended contributions to its pension and OPEB systems and is arguably its most costly and least transparent debt. Decades of not making those annual contributions, plus forgone investment returns on the missed contributions, resulted in a liability of about $166 billion as of the end of fiscal 2020.
The Volcker Alliance gave New Jersey a D average in Budget Maneuvers for fiscal 2015–19. The low grade was mostly due to the state’s heavy use of revenue and cost shifts and funding recurring expenditures with debt, asset sales, and upfront payments on financings.
Lesson for New York
Recommendations and Conclusion
Under New York State’s diverse debt structure, investors may have made artificial distinctions among state borrowers and overallocated their portfolios to bonds from New York issuers than their usual limits on risk might otherwise allow. This may pose challenges for New York in a fiscal or financial crisis. In such a crisis, investors might ignore distinctions among securities—as they did in the Detroit and Puerto Rico bankruptcies—and spark a selling wave just when the state would most need access to credit markets.
We thus recommend that New York State:
-
Adopt a more inclusive view of which outstanding debt obligations are its direct responsibility.
-
Establish a better system of administrative controls over this portfolio of debt.
-
Stretch statutory debt limitations around a larger universe of obligations.
-
Dramatically improve transparency in all categories of debt.
-
To the extent it can, fold unfunded pension, OPEB, and unemployment insurance liabilities into existing debt limits and transparency mechanisms to improve management and oversight.
-
Enumerate its aggregate future costs to repair and replace all critical public infrastructure assets.
-
Undertake a full accounting of its physical assets, their current state of service and utility, and a range of cost estimates for repair, including any apparent deficiencies related to climate change.
-
Improve control over all state borrowing, along the lines of Florida’s structure. This may not be legally or politically viable in the medium term, but a centralized advisory entity that is actively involved in debt originations of all kinds within state government could at least enable data collection and dissemination. New York’s budget division, which answers to the governor and already coordinates all borrowing via state-supported structures, is a likely candidate for this role—perhaps in partnership with the independently elected state comptroller, who already guides general obligation bond issuance and has broad oversight responsibilities for state debt.
We also recommend that public and private lenders to the state and its authorities consider many of New York’s revenue bonds economically or politically consolidated with its general obligation, personal income tax, and sales tax securities. That would make all subject to the same exposure limitations on risk of a single borrower that may be contained in bondholders’ investment policies.
Without such consideration of security consolidation, taxpayers, investors, and state officials will continue to lack a clear picture of the state’s total debt. Improving transparency may help New York avoid its access to markets being impeded in any future financial crisis. Equally important, a distinct view of the cost to taxpayers of the state’s diversified debt structure may help New York reduce its longtime reliance on unsustainable one-time revenue measures to achieve budgetary balance.
APPENDIX A: NEW YORK COMPARED WITH FOUR OTHER STATES
California
Florida
Michigan
New Jersey
New York
APPENDIX B: GLOSSARY
These definitions are based on research by the Volcker Alliance and Municipal Market Analytics; the Handbook of International Financial Terms, by Peter Moles and Nicholas Terry (Oxford: Oxford University Press, 1997); and other explanatory documents published by the California Debt and Investment Advisory Commission, the Governmental Accounting Standards Board, Investopedia, Fitch Ratings, the Municipal Securities Rulemaking Board, the National Association of Attorneys General, the National Association of State Retirement Administrators, TransparentNH (New Hampshire’s disclosure website), the New York State Division of the Budget, the Urban Institute, and the US Census Bureau, Social Security Administration, and Treasury.
Find the full glossary here
ACKNOWLEDGMENTS
This report was made possible in part by a grant from the Peter G. Peterson Foundation. The statements made and views expressed are solely the responsibility of the authors. We acknowledge the considerable support provided by the late Paul A. Volcker, the Volcker Alliance’s founding chairman, as well as the numerous academics, government officials, and public finance professionals who have guided the Alliance’s research on state budgets for the last seven years. We also thank these colleagues and government officials who helped broaden our understanding of state debt practices.
Thomas DiNapoli, New York State Comptroller
Thomas G. Doe, Founder and President, Municipal Market Analytics
Maria Doulis, New York State Deputy Comptroller for Budget and Policy Analysis
Nina Kambili, Program Assistant, The Volcker Alliance
Gabriel Petek, California Legislative Analyst
Pat Reale, New York State Assistant Comptroller for Debt Management
Tim Schaefer, California Deputy Treasurer for Public Finance
Nicholas Sourbis, Managing Director, Municipal Market Analytics
J. Ben Watkins, Director, Florida Division of Bond Finance
Endnotes
1. The Volcker Alliance, Truth and Integrity in State Budgeting: Preparing for the Storm, March 2020, 95, link.
2. National Bureau of Economic Research, “US Business Cycle Expansions and Contractions,” last updated July 2021, link.
3. State of New York, Office of the Comptroller, Comprehensive Annual Financial Report for Fiscal Year Ended March 31, 2019, 222, link.
4. The Volcker Alliance, Truth and Integrity in State Budgeting: Preparing for the Storm, 94, link.
5. The Volcker Alliance, Truth and Integrity in State Budgeting: Preparing for the Storm, 94, link.
6. The Volcker Alliance, Truth and Integrity in State Budgeting: Preparing for the Storm, 93, link.
7. The Volcker Alliance, Truth and Integrity in State Budgeting: Preparing for the Storm, 93, link.
8. State of New York, Office of the Comptroller, Fiscal Condition Report for Fiscal Year Ended March 31, 2021, 28, link.
9. State of New York, Office of the Comptroller, Public Authorities by the Numbers, January 2017, 10, link.
10. State of New York, Office of the Comptroller, New York State and Local Retirement System Comprehensive Annual Financial Report for Fiscal Year Ended March 31, 2021, 74, link.
11. State of New York, Office of the Comptroller, Public Authorities by the Numbers, January 2017, 1, link.
12. The Pew Charitable Trusts, Strategies for Managing State Debt: Affordability Studies Can Help States Decide How Much to Borrow, April 2018, 40–45, link.
13. State of New York, Division of the Budget, New York State Debt Reform Act of 2000, link.
14. State of New York, Division of the Budget, Annual Information Statement and Financial Disclosure, link.
15. State of New York , Division of the Budget, Annual Information Statement, June 8, 2021, 194, link.
16. State of New York, Division of the Budget, Statement of Updated Annual Information for FY 2020, July 29, 2020, B–5, link.
17. New York State Constitution, Article VII, Section 11, link.
18. State of New York, Division of the Budget, FY2022 Enacted Capital Program and Financing Plan, 32, link.
19. David McKay Wilson, “How the IRS Just Squashed Attempts by New York, New Jersey to Work around Tax-Deduction Limit,” June 11, 2019, link.
20. State of New York, Office of the Comptroller, Debt Impact Study: An Analysis of New York State’s Debt Burden, December 2017, 3, link.
21. State of New York, Office of the Comptroller, Debt Impact Study: An Analysis of New York State’s Debt Burden, December 2017, 4, link.
22. The Pew Charitable Trusts, The State Pension Funding Gap: Plans Have Stabilized in Wake of Pandemic, September 2021, 14–16, link.
23. The Pew Charitable Trusts, The State Pension Funding Gap: Plans Have Stabilized in Wake of Pandemic, 15, link.
24. US Treasury, “Title XII Advance Activities Schedule,” as of Oct. 13, 2021, link.
25. Moody’s Investors Service, Medians—State Debt Rose 2.5% in 2020, Spurred by Pandemic-Linked Borrowing, June 14, 2021, 7.
26. Standard and Poor’s, US States Weigh Risk Reduction In Managing Pension and OPEB Liabilities, Sept. 20, 2021, link.
27. US Department of Labor, Trust Fund Loans (outstanding loans from the Federal Unemployment Account as of Oct. 5, 2021), link.
28. State of Florida, Division of Bond Finance, link.
© 2022 VOLCKER ALLIANCE INC.
Published January, 2022
The Volcker Alliance Inc. hereby grants a worldwide, royalty-free, non-sublicensable, non-exclusive license to download and distribute the Volcker Alliance paper titled New York: State of Debt (the “Paper”) for non-commercial purposes only, provided that the Paper’s copyright notice and this legend are included on all copies.
This paper was published by the Volcker Alliance as part of its Truth and Integrity in Government Finance Initiative. The views expressed in this paper are those of the authors and do not necessarily reflect the position of the Volcker Alliance. Any errors or omissions are the responsibility of the authors.
Don Besom, art director; Michele Arboit, copy editor.


